Discussion and Major Findings
a. Instrument Tuning
Testing on NIST 612 with the following parameters:
- 75 µm spot size
- 65 % laser power, corresponding sample fluence energy ≈ 3.3 J/cm^2
- He was the carrier gas (flow rate = 800 ml/min) used in the ablation cell due to its high transport efficiency and low particle agglomeration. Upon exit, He is mixed with Ar (flow rate = 800 ml/min) to enhance ionization efficiency while minimizing interference.
- Sample depth = 6.5 mm (lower sample depth enhances sensitivity of trace elements)
- Integration time = 0.1 sec, sampling period = 0.72 sec, and n = 50
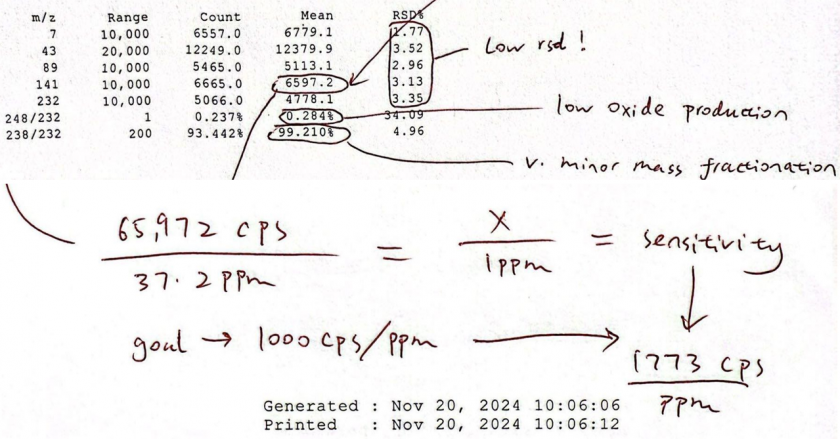
- 6579.2 counts/0.1sec = 65792 counts/sec
- Known concentration for m/z = 141 is 37.9 ppm
- Low RSD% ensures high precision
- Low oxide production – 248/232 = ThO/Th = 0.284%, 0.284 * 34.09% = 0.097
- m/z 238/232 = 99.21% indicates minor mass fractionation because this percentage matches well with the known U/Th ratio of the NIST 612 standard although U and Th have similar masses.
- The system was optimized daily for sensitivity across the AMU mass range and low oxide production (ThO/Th: 0.284 ± 0.097%) by running on a standard (NIST 612)
b. Acquisition mode – time resolved analysis
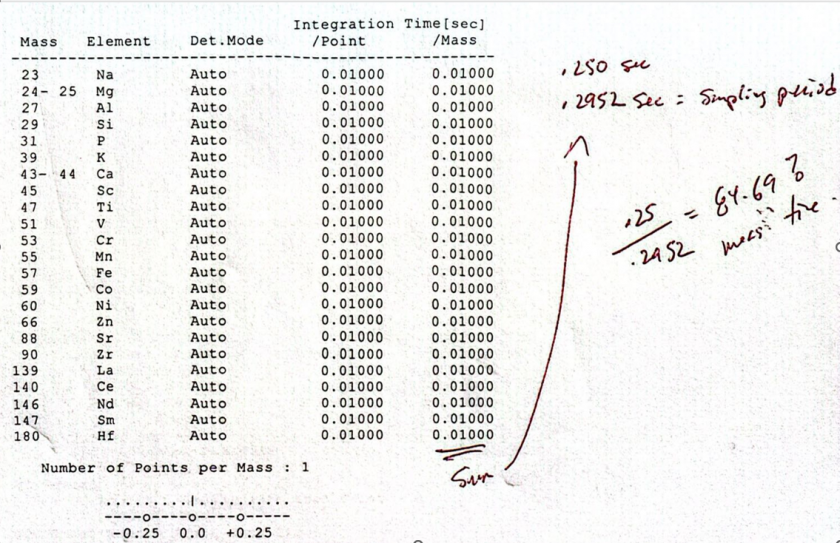
- Besides time spent on measuring, sampling period also includes sample uptake and instrument stabilization time
- We want to maximize percentage of time spent on measuring
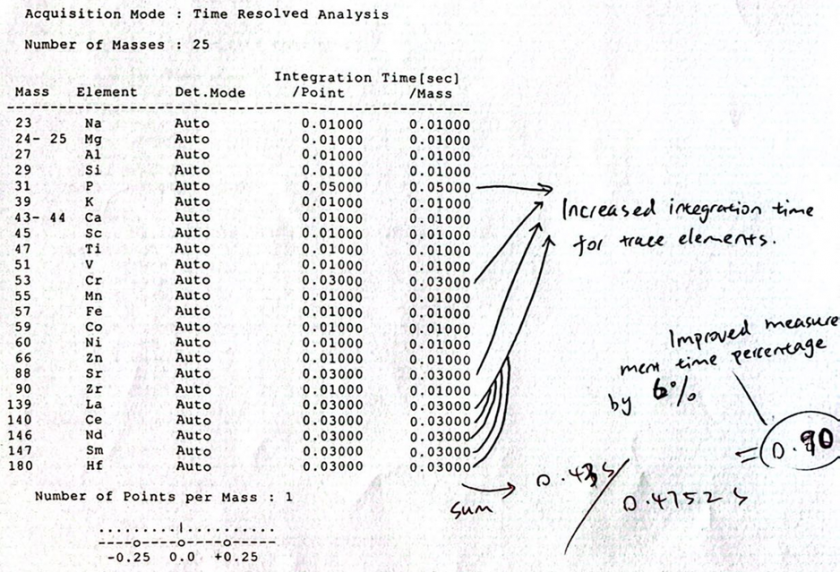
Image above is the updated time-resolved analysis
c. Tests on “Sacrificial” Olivine and Serpentine grains to optimize laser conditions
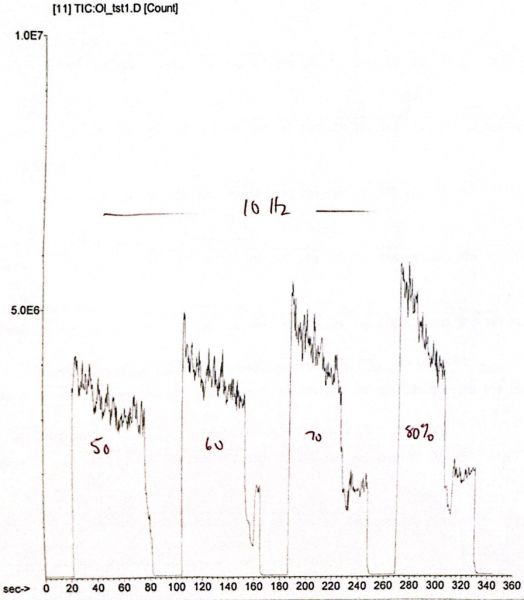
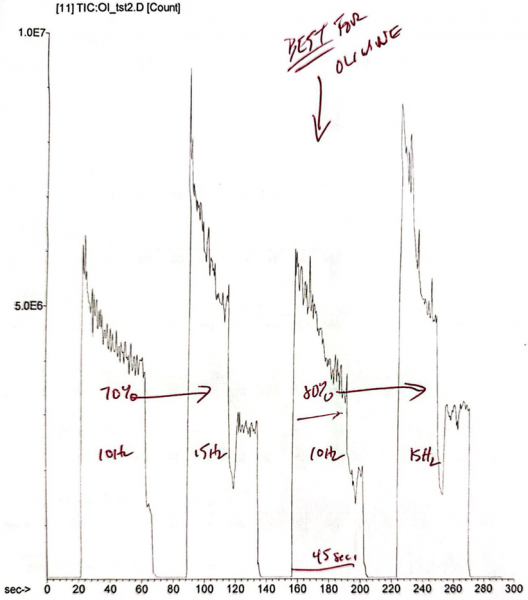
- The plot above illustrates the ablation of a “sacrificial” olivine grain under different laser conditions, with each peak representing a distinct laser condition. The x-axis represents time and the y-axis represents signals of the ablated materials. All peaks correspond to the same repetition rate of 10 Hz. From left to right, the laser powers for each peak are 50, 60, 70, and 80%.
- As shown by the plot, laser power is proportional to signal intensity, but excessively high laser power can over-ablate the thin section and vaporize the glass slide. This is particularly problematic for my sample, with a sample thickness of only 30 µm.
- Thin section burn-through: The peaks at 60%, 70%, and 80% laser powers show a secondary peak at the end, with it becoming more pronounced with increasing laser powers. This occurs because higher laser powers and frequencies burn through the thin section and ablate part of the glass slide. Therefore, the secondary peak represents the glass slide instead of the thin section.
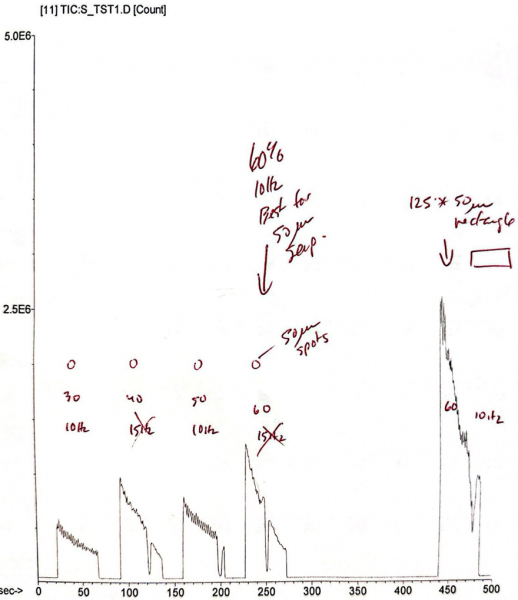
The above plot illustrates the ablation of a “sacrificial” serpentine vein under different laser conditions. The first, third, and fifth peaks were generated with a 10 Hz repetition rate, while the second and the fourth peaks were generated with a 15 Hz repetition rate. Repetition rate determines the number of laser pulses being generated per second. A laser with higher repetition rates effectively smooths out the zig-zag pattern evident on the peak produced with a lower repetition rate. This zig-zag pattern is called a “spectral skew” where the aerosol mass introduced varies over the duration of the mass scan (Hattendorf et al., 2019). Dampening this effect improves signal consistency.
- The plot above illustrates another test on an olivine grain to further show how different combinations of repetition rates, dwell time, and laser power will affect the resulting signal peaks.
- Dwell time – Dwell time represents the amount of time spent on ablating the sample. At first, we chose a dwell time of 60 s but realized it’s too long that the laser ended up ablating part of the glass slide. The last part of the corresponding signal peaks represent the glass slide instead of the sample. Therefore, we reduced the dwell time down to 45 s to minimize glass slide ablation.
- Sampling depth – Refers to the distance between the torch and the sampler cone. It was reduced from 8 mm down to 6.5 mm to increase analyte sampling and therefore to increase sensitivity.
- After a comprehensive assessment of laser conditions and a careful comparison between different resulting signal peaks, the finalized laser parameters for olivine and serpentine ablations are summarized by the table below. These parameters will be used for the actual measurements.
| Finalized laser conditions for olivine ablation | Finalized laser conditions for serpentine ablation | |
| Repetition rate (Hz) | 10 | 10 |
| Spot size (µm) | 125 | 50 |
| Dwell time (sec) | 45 | 45 |
| Gb (gas blank) | 20 | 20 |
| Carrier gas (He) flow rate (ml/min) | 800 | 800 |
| Makeup gas (Ar) flow rate (ml/min) | 800 | 800 |
| Sampling depth (mm) | 6.5 | 6.5 |
d. Olivine Measurements
e. Serpentine vein measurements
f. Methodology – See “Methodology” Page
g. Iolite data reduction
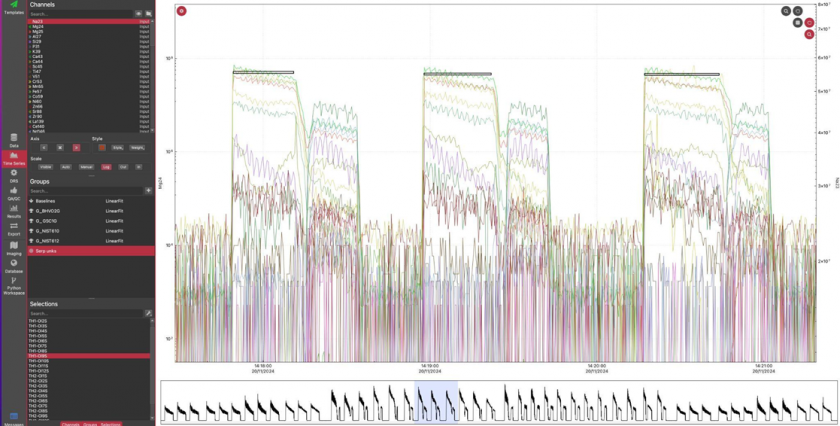
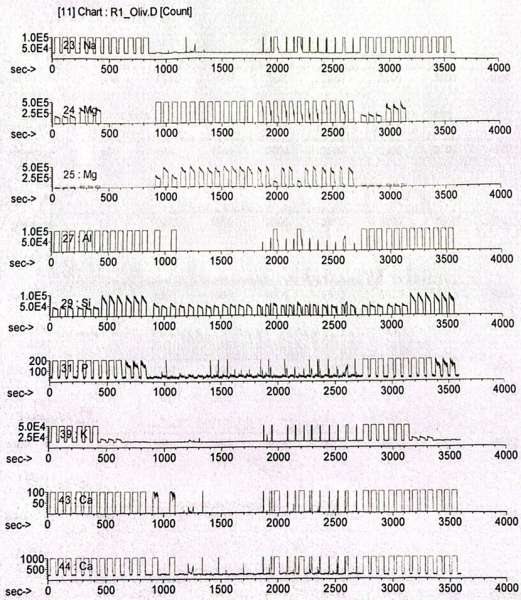
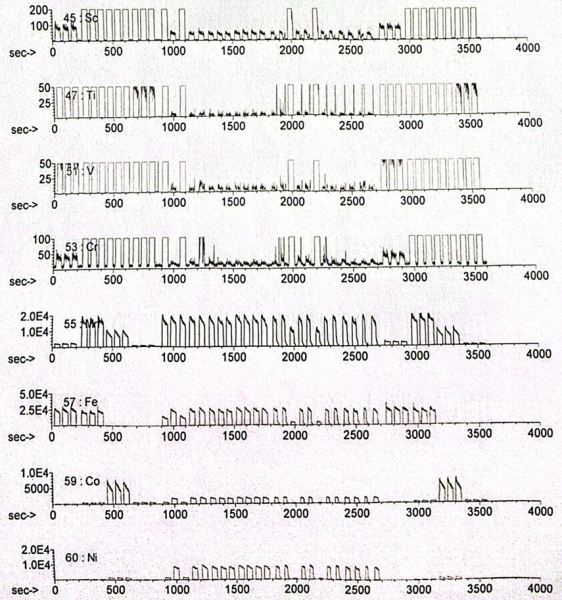
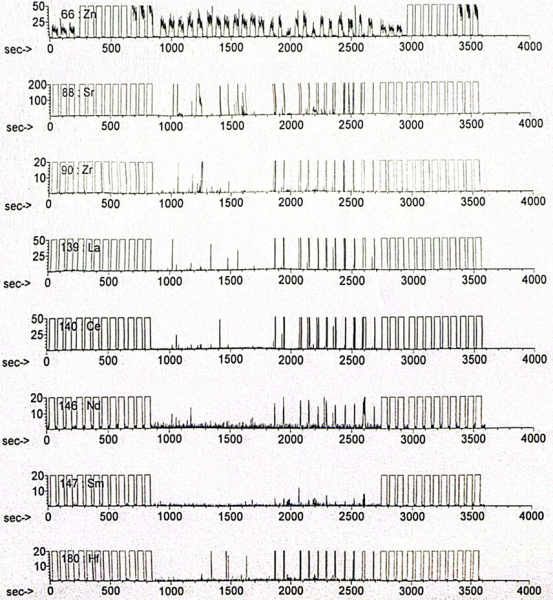
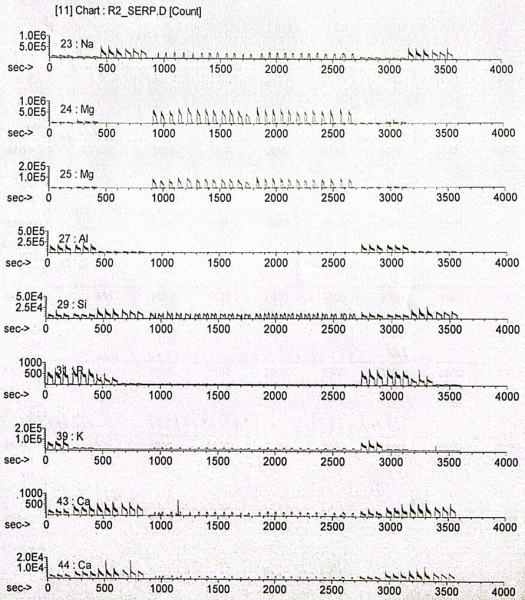
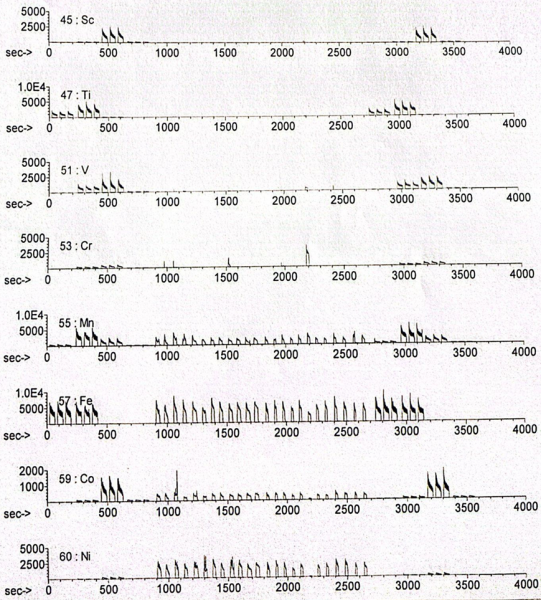
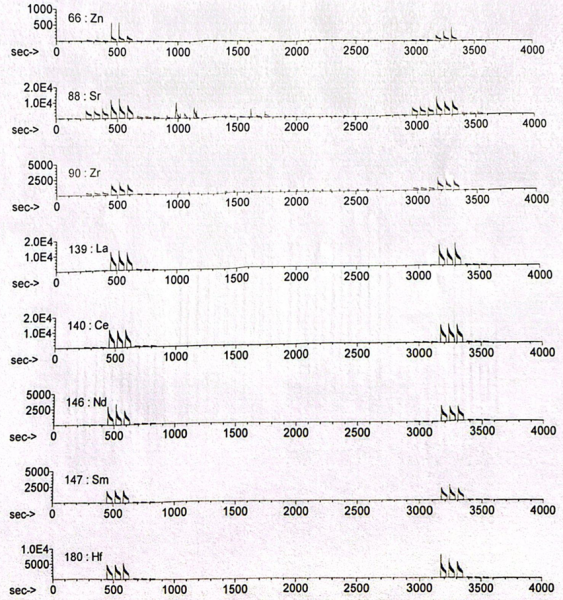
The image above shows the signal intensity curves for all elements in the serpentine veins. The signal peaks represent the ablated materials and the x-axis represents time. The rectangles at the top of the signal peaks indicate the parts of the curves that will be converted to isotope concentrations. Originally, the rectangles span over the entire signal peaks including the secondary peaks following the tallker peaks. I manually narrowed the rectangles so that they only cover the primary peaks because the secondary peaks indicate laser burn-through and therefore represent the concentration of the glass slide instead of the sample.
h. Data Exportation
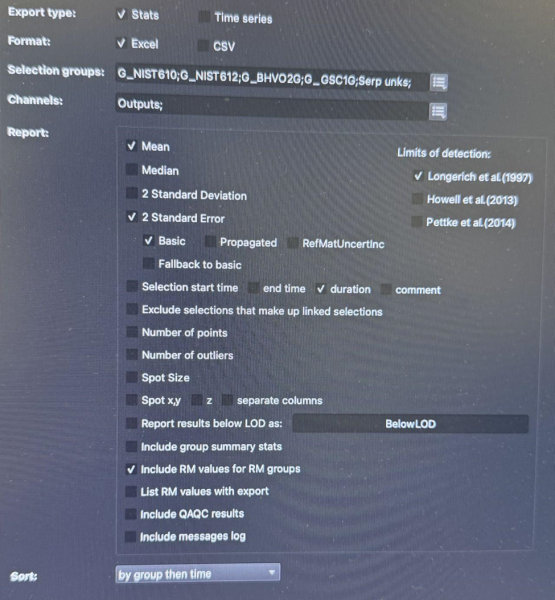
After filtering out the unwanted parts of the signal curves, I began exporting the data and selecting the options shown in the above image. Calculations for the limits of detection were based on the study of Longerich et al. 1997.