Data Quality
REAGENTS UTILIZED
All chemicals used in the study were of analytical grade unless stated otherwise and were utilized as received. Concentrated nitric acid (HNO3, 70%) and hydrochloric acid (HCl), both trace metal-grade, were employed for the digestion of aminoboration samples. A 2% HNO3 solution, prepared using nitric acid certified for trace element analysis and ultra-high purity water (18MΩ·cm), was used to prepare all ICP-MS samples.
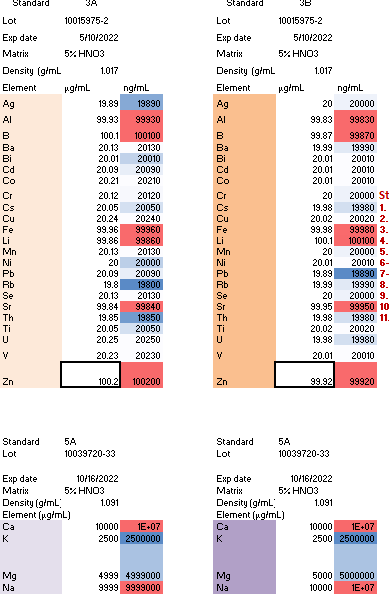
The two standard stock solutions used in the study are outlined in Table 1. Stock A was employed for preparing the calibration curve, while Stock B was used to create the quality control solutions. Single-element standards, including Sc at 2000 ppb and Ge at 400 ppb each, were used to prepare the internal standards. The information regarding each standard solution is provided in the images and Table 1 below.
Table 1: Concentrations in ppm for each component in Stock A and Stock B for the calibration curves and quality controls, respectively.
Method Sequence
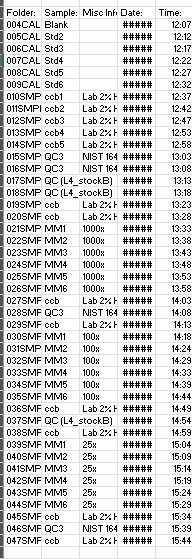
Find below in Table 2 the method sequence used during the ICP-MS operation in sample analysis.
Table 2: Method sequence for analysis on ICP-MS.
CALIBRATION STANDARDS
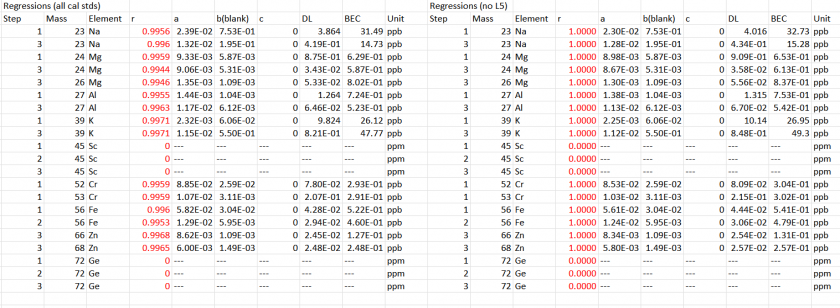
The analytes of interest were quantified using a calibration curve created from multi-elemental standards, as shown in Figure 2. The plots exhibit strong linearity, with a high coefficient of determination, demonstrating the reliability of the calibration method.
Table 3: Determination of degree of fit for element calibration curves. The fit equation is given as Y = ax +b where Y represents the intensity (cps) and x is the concentration of the analyte (ppb). DL means Detection limit and BEC is the background equivalent concentration.
Analytical figures of Merit
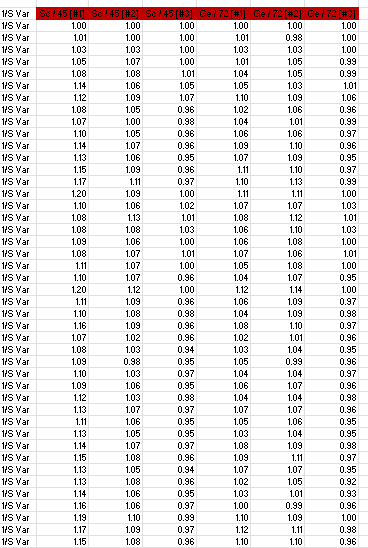
An internal standard is valuable for tracking analyte recoveries in the event of instrumental drift. The selection of internal standards is based on the similarity of elements’ mass and ionization energy. In this study, the internal standards used were 45Sc for 39K, 23Na, 27Al, and 56Fe and 72Ge for 66Zn. The recoveries of these internal standards were excellent, as indicated in Table 4. Table 5 presents the range of calibration standards for each analyte, with concentrations arranged from blank to increasing concentrations down the column.
Table 4: Recoveries for internal standards used. Note that [#1] represents Helium mode, [#2]-Hydrogen mode, and [#3]-No gas mode
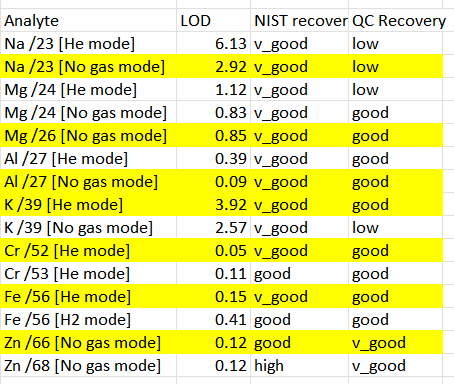
I calculated the recovery of the quality control standards as well as the detection limits of the analytes to assess the performance of the analytical methods. The results of these calculations are presented in Table 5.
Table 5: Recovery of Quality Control Standards and Detection Limits of Analytes