Methodology
Instrument Tuning
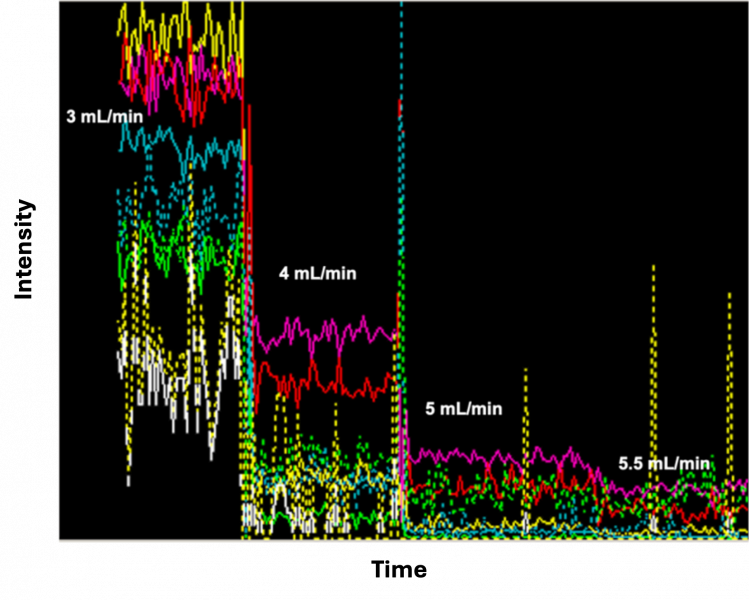
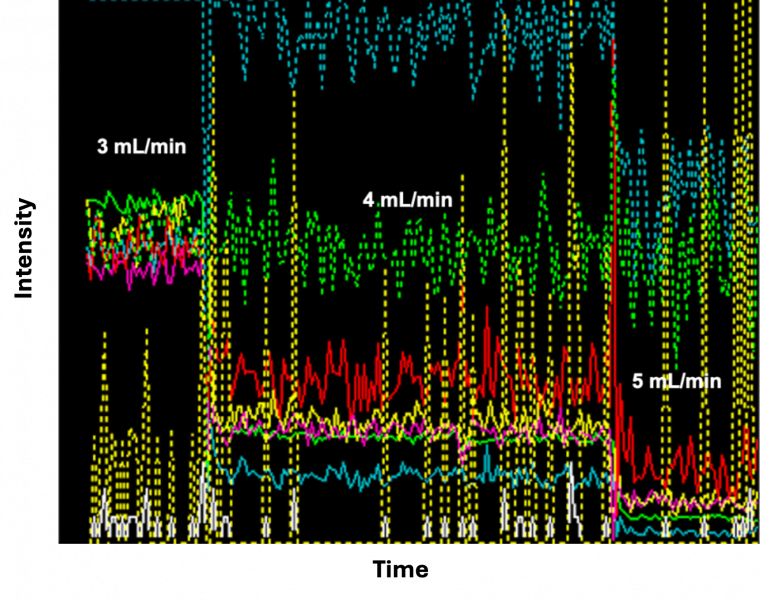
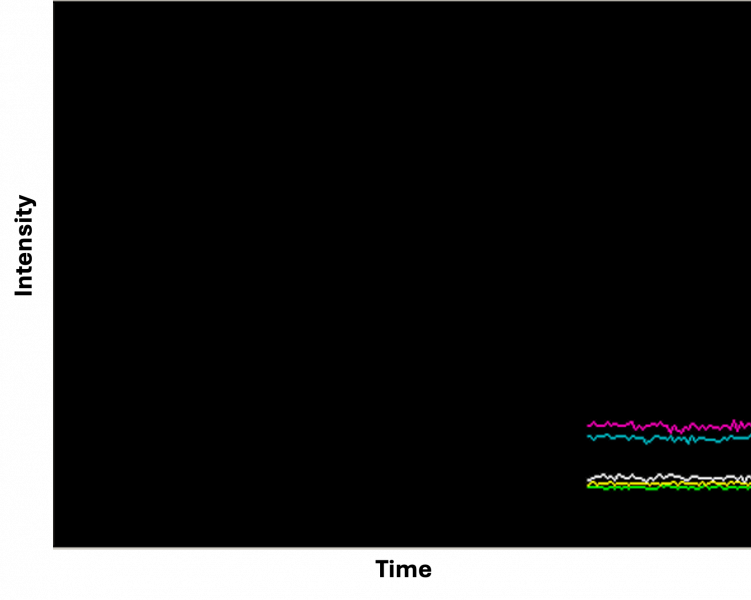
The instrument was tuned to achieve high-sensitivity data by mitigating interferences. The Octopol Reaction System (ORS) was used to deal with polyatomic and isobaric interferences. Three different modes, including “He mode,” “H2 mode,” and “No gas mode,” were used to cope with the interferences.
“He mode” tunning

“H2 mode” tunning

“No gas mode” final tunning

Cation concentrations (Li, B, Na, Mg, Al, Si, P, K, Ca, Ti, V, Cr, Mn, Fe, Ni, Cu, Zn, Se, Rb, Sr, Mo, Ru, Rh, Pd, Sb, Ba, Ir, Pt, Pb, and U) were determined on (11/21/2024) using an Agilent 7500ce ICP-MS at the University of Texas at Austin. (Dept. of Geological Sciences). The instrument was optimized for sensitivity across the AMU range while minimizing oxide production (CeO/Ce <1.05%). The quantitative analytical method employed an octopole reaction system (ORS), operated in helium (collision mode) and hydrogen (reaction mode) for the removal of polyatomic interferences. Internal standards, mixed into unknowns via in-run pumping, were used to compensate for instrumental drift, and internal standard sensitivity variations were well within QA tolerances (60-160%). Limits of detection, based upon the population of blank (2% HNO3) analyses interspersed throughout the analytical sequence, were typically better than 0.025 ppb (median = 0.134 ppb) for analytes measured in optimal modes (with or without the ORS). Analyte recoveries obtained for replicates of independent quality control standards; stock B: B1 (T2-MEB727310), B2 (T2-MEB7277312), B3 (T2-MEB727309), B5 (T2-MEB727313), B6 (T2-MEB727307), and CMS-2 B (U2-MEB732514) were typically within 4% of commercial NIST-1643f standard certified values. Relative precisions (n = 8) obtained for these quality control standards were usually within 1% to 3% of replicate averages. ICP-MS analytical parameters are shown in the table below.
| ICP-MS Instrument | Agilent 7500ce ICP-Q-MS |
| Plasma Conditions | |
| Nebulizer | PFE microflow with 90 µL/min uptake rate |
| Nebulizer pumps (rps) | 0.2 |
| Spray Chamber | Scott-type (quartz) with Peltier cooling (2°C) |
| Sampling Depth (mm) | 8 |
| RF Power (W) | 1600 |
| RF Matching (V) | 1.7 |
| Carrier gas flow (L/min) | 0.85 |
| Make-up gas flow (L/min) | 0.35 |
| Cones | Ni |
| Reaction cell (ORS) modes and masses measured | |
| He mode (5.3 mL/min) | 23, 24, 26, 27, 39, 43, 44, 45, 51, 52, 53, 56, 72, 115 |
| H₂ mode (3.3 mL/min) | 28, 40, 45, 56, 72, 78, 115 |
| No gas mode | 7, 9, 11, 23, 24, 26, 27, 31, 39, 43, 44, 45, 47, 51, 55, 60, 63, 66, 68, 72, 82, 85, 88, 95, 101, 103, 105, 115, 121, 125, 137, 175, 193, 195, 206, 207, 208, 238 |
| Internal stds | 9, 45, 72, 115, 125, 175 |
| Detection system | Dual stage (pulse & analog) discrete dynode electron multiplier |
| Data Acquisition | |
| Scan mode | Peak hopping |
| Points across peak | 3 |
| Integration per mass (sec) | 0.100 |
| Replicates | 3 |
| m/z | Element | Range | Count | Mean | RSD% |
| 9 | Beryllium | 500,000 | 51240.0 | 52179.9 | 1.21 |
| 45 | Scandium | 5,000,000 | 515934.0 | 530227.0 | 1.20 |
| 72 | Germanium | 100,000 | 17440.0 | 17726.4 | 1.37 |
| 115 | Indium | 1,000,000 | 150559.0 | 152106.4 | 1.16 |
| 125 | Tellurium | 50,000 | 8004.0 | 8101.7 | 1.63 |
| 175 | Lutetium | 2,000,000 | 249354.0 | 250234.6 | 1.32 |
Method Sequence
Analytical sequence was determined before starting the run while the method being created. Typical sequence will include the start of blanks, calibration standards, lab blanks, QC calibration standards, and lab blanks in sequence. This sequence is repeated again in the middle and end of the run to make sure the instrument has the precise calibration of mass range, accurate quantification of target analytes, and thus provide reliable ICP-MS results.