Data Quality
Sample Preparation
Seventeen water samples were collected from the autoclave experiment for the reaction of the sandstone with Nitrogen gas at various temperatures, including 60°C and 200°C. The samples were treated with 30 µL of trace metal grade HCl and then were diluted according to the arranged dilution scheme, which was appropriate (10X for DF). Thus, around 0.5 mL from the water sample was captured in a tube and diluted by adding 4.5 mL of 2% HNO3 to reach the required dilution.
Calibration Standards
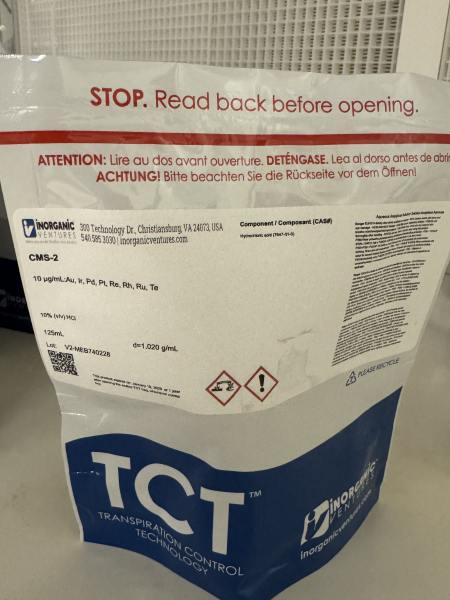
Developing a logic matrix was vital in determining the appropriate ratios for each calibration standard in the solution. Each calibration standard is ranked starting from (L6 to L1) where L6 represents the limit of detection (LOD), and L1 is blank and with the following relationship: L1 = 0, L2=L3/10, L3=L4/10, L4=L6/10, L5=L6/2. In this analysis, thirty elements were quantified in each water sample, including (Li, B, Na, Mg, Al, Si, P, K, Ca, Ti, V, Cr, Mn, Fe, Ni, Cu, Zn, Se, Rb, Sr, Mo, Ru, Rh, Pd, Sb, Ba, Ir, Pt, Pb, U). Thus, developing and determining the required dilution for each element was necessary. This was achieved by dividing each element’s concentration within the standard used by the concentration in L6. We knew how much the required dilution was for each element as we had a previous run using a Hydrogen gas reaction with the sandstone in the autoclave instead of Nitrogen, so we did not need semi-quant data for our run. In this analysis case, there was a need to create an L7 which will involve a two-step dilution to reach the required dilution as some elements (Si and P) showed too high values for the required dilution (1000), which should be done in two steps. Thus, an L7 was created. Making calibration standards and quality control standards were used in the analysis. The standards used included (A) stock: A1, A2, A3, A5, A6 and (B) stock: B1, B2, B3, B5, B6; in addition to metals standards (CMS-2) (A) and (B) which were added to verify some elements reactivity from the autoclave vessel itself. For the QC standards, an L4 was made from an L7 and L6 and was used for the calibration curves. Moreover, additional QC standard (NIST 1643f) was added to the run sequence to verify results and have good grasp on our data correlation coefficient values (r).

The calibration results show excellent calibration coefficient results, with those falling within 0.9999 to 1.0000, indicating excellent recoveries. Additionally, the LOD of detections for elements was sensitive, with fractions of (ppb) for most elements and few (ppb) for some elements, which indicates high instrumental sensitivity. For the quality control standards recoveries, the majority of the elements showed very good to good recoveries from the made quality control calibration standard and similarly for the commercial (NIST 1643f) quality control standard, with few elements not reported in the latterly mentioned standard.
| Isotope | Calibration (rho) | LOD (ppb) | ORS Mode | QC1 Recovery | QC2 Recovery |
| 7Li | 1.0000 | 0.242 | no gas | 1.06 | 1.09 |
| 11B | 0.9999 | 0.518 | no gas | 0.93 | 0.90 |
| 23Na | 1.0000 | 5.240 | no gas | 1.05 | 1.04 |
| 24Mg | 1.0000 | 1.323 | no gas | 1.07 | 1.06 |
| 27Al | 1.0000 | 0.113 | no gas | 1.08 | 1.06 |
| 28Si | 1.0000 | 16.289 | H2 | 1.05 | – |
| 31P | 0.9996 | 1.386 | no gas | 1.00 | – |
| 39K | 1.0000 | 8.961 | He | 1.04 | 1.05 |
| 44Ca | 1.0000 | 3.613 | no gas | 1.07 | 1.03 |
| 47Ti | 1.0000 | 0.031 | no gas | 1.03 | – |
| 51V | 1.0000 | 0.030 | no gas | 1.05 | 1.02 |
| 52Cr | 1.0000 | 0.059 | He | 1.02 | 1.05 |
| 55Mn | 1.0000 | 0.138 | no gas | 1.08 | 1.07 |
| 56Fe | 1.0000 | 0.448 | H2 | 1.02 | 1.04 |
| 60Ni | 1.0000 | 0.110 | no gas | 1.06 | 1.05 |
| 63Cu | 0.9999 | 0.047 | no gas | 1.06 | 1.05 |
| 66Zn | 0.9999 | 0.120 | no gas | 1.07 | 1.06 |
| 82Se | 1.0000 | 0.082 | no gas | 1.04 | 1.03 |
| 85Rb | 1.0000 | 0.023 | no gas | 1.09 | 1.09 |
| 88Sr | 0.9999 | 0.171 | no gas | 1.03 | 1.06 |
| 95Mo | 0.9999 | 0.173 | no gas | 1.00 | 0.98 |
| 101Ru | 1.0000 | 0.025 | no gas | 1.03 | – |
| 103Rh | 1.0000 | 0.026 | no gas | 1.09 | – |
| 105Pd | 1.0000 | 0.044 | no gas | 1.06 | – |
| 121Sb | 1.0000 | 0.025 | no gas | 1.03 | 1.00 |
| 137Ba | 0.9999 | 0.023 | no gas | 1.02 | 1.00 |
| 193Ir | 1.0000 | 0.025 | no gas | 1.04 | – |
| 195Pt | 1.0000 | 0.028 | no gas | 1.03 | – |
| 208Pb | 1.0000 | 0.025 | no gas | 1.04 | 1.03 |
| 238U | 1.0000 | 0.022 | no gas | 0.95 | – |