Results
Membrane Performance Results
The flux stepping experiments shown in Figure 6 show that CaCl2, the only non-oxyanion, fouls faster than the other anions. So fast in fact that the experiment was stopped at 140 LMH to prevent the system from damaging a pressure transducer.
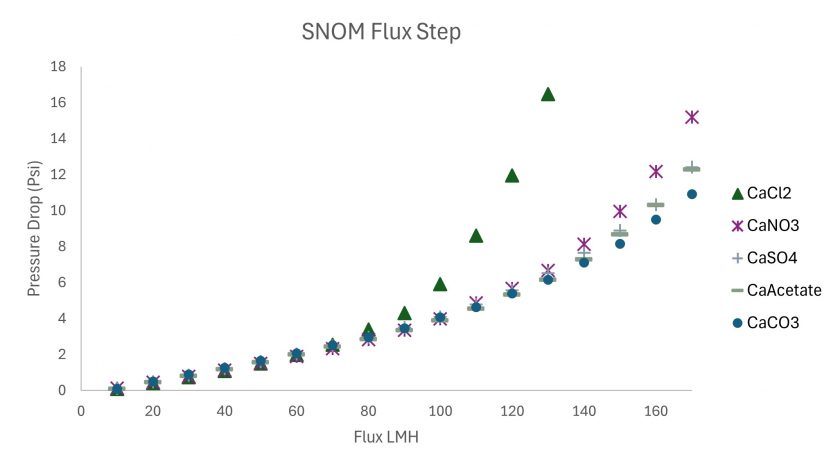
Figure 6. Flux Stepping Experiments for the different water chemistries
The threshold flux can be calculated through a series of linear regressions, as shown in Figure 7. A linear regression is built starting at the first flux step, and subsequent steps are added until a poor linear fit occurs, the blue line in Figure 7. Once this point is determined, a line is drawn through the next two flux steps, the orange line Figure 7. Where these two lines intersect is the threshold flux.
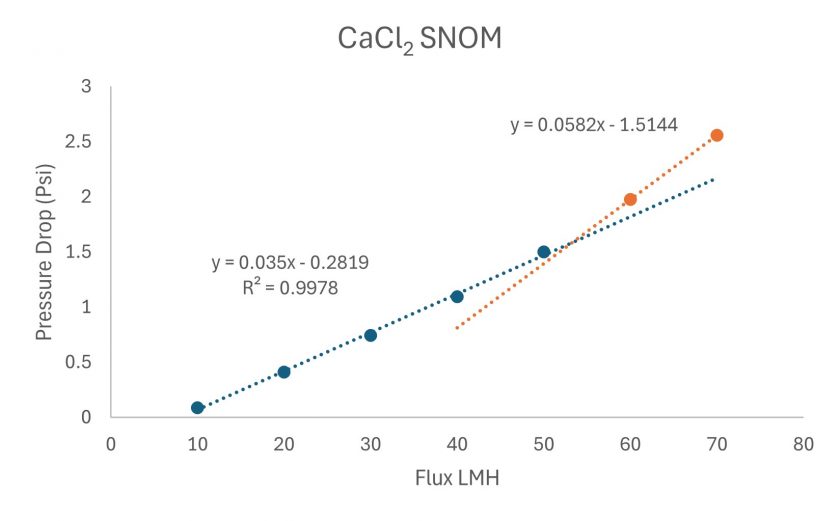
Figure 7. Threshold Flux determination of the CaCl2 experiment.
The threshold flux for each experiment can be seen in Table 6.
Table 6. Threshold Flux Results
| Experiment | Salt | Threshold Flux (LMH) |
| 1 | CaCl2 | 53.8 |
| 2 | Ca(NO3)2 | 68.5 |
| 3 | CaSO4 | 71.4 |
| 4 | Ca(Acetate)2 | 81.2 |
| 5 | CaCO3 | 83.6 |
ICP MS Feed Results
The ICP MS results of the feed samples show that the apparent change in Ca concentration is negligible and falls within the QRSD of both measurements. The Na concentration increases for all experiments except for experiment 5. The addition of NaOH as a pH buffer during the experiments could cause this apparent increase, however the data quality of the Na data is questionable, low signal to noise and high QRSD, and further analysis would be needed to verify any trends. The decrease of Na seen in experiment 5 appears to be negligible.
Table 7. Feed Solution Concentrations
| Experiment | 23Na (ppm) | 40Ca (ppm) | 43Ca (ppm) | 44Ca (ppm) | ||||||||||
| 1 | Initial Feed | 1.25 | + | 0.21 | 204.9 | + | 3.24 | 205.3 | + | 15.8 | 210.6 | + | 15.5 | |
| Final Feed | 3.75 | + | 0.52 | 197.7 | + | 1.05 | 196.8 | + | 19.1 | 201.1 | + | 21.2 | ||
| Difference | 2.50 | 7.2 | 8.5 | 9.5 | ||||||||||
| 2 | Initial Feed | 1.80 | + | 0.15 | 200.7 | + | 2.09 | 226.3 | + | 4.9 | 230.6 | + | 4.8 | |
| Final Feed | 3.60 | + | 0.56 | 197.6 | + | 3.16 | 195.4 | + | 20.5 | 202.0 | + | 23.3 | ||
| Difference | 1.80 | 3.1 | 30.9 | 28.6 | ||||||||||
| 3 | Initial Feed | 2.98 | + | 0.36 | 204.7 | + | 1.74 | 209.5 | + | 9.8 | 215.2 | + | 10.9 | |
| Final Feed | 4.16 | + | 0.54 | 206.4 | + | 1.05 | 209.4 | + | 17.7 | 214.8 | + | 17.3 | ||
| Difference | 1.18 | -1.7 | 0.1 | 0.4 | ||||||||||
| 4 | Initial Feed | 2.12 | + | 0.33 | 196.1 | + | 2.92 | 196.0 | + | 15.8 | 201.0 | + | 16.7 | |
| Final Feed | 3.93 | + | 0.54 | 189.9 | + | 1.75 | 186.9 | + | 16.9 | 192.2 | + | 18.5 | ||
| Difference | 1.81 | 6.2 | 9.1 | 8.8 | ||||||||||
| 5 | Initial Feed | 17.71 | + | 0.46 | 190.3 | + | 0.72 | 205.3 | + | 3.2 | 210.1 | + | 1.9 | |
| Final Feed | 16.32 | + | 1.66 | 190.3 | + | 1.47 | 190.6 | + | 17.2 | 193.8 | + | 16.1 | ||
| Difference | 1.39 | 0.0 | 14.7 | 16.3 | ||||||||||
ICP MS Digested Results
The ICP MS results of the digested samples were normalized for the 100 ml dilution with Mili-Q® water and the total area of the digested membrane. The Pristine membrane seems to have a higher concentration than the CaCl2 experiment. This could be due to environmental contamination from the sample prep and from cutting this experiment early at 140 LMH and not 170 LMH.
Table 8. Digested Sample Mass per Area
| Experiment | Area (cm2) | 23Na (µg/cm2) | 40Ca (µg/cm2) | 43Ca(µg/cm2) | 44Ca (µg/cm2) | |||||||||
| Pristine PS Membrane | 9.51 | 0.17 | + | 0.03 | 5.05 | + | 0.05 | 3.31 | + | 0.27 | 3.35 | + | 0.23 | |
| 1 | CaCl2 | 9.00 | 0.17 | + | 0.04 | 2.49 | + | 0.02 | 2.46 | + | 0.19 | 2.50 | + | 0.23 |
| 2 | Ca(NO3)2 | 9.22 | 0.32 | + | 0.05 | 4.52 | + | 0.05 | 4.47 | + | 0.40 | 4.61 | + | 0.39 |
| 3 | CaSO4 | 9.00 | 0.26 | + | 0.13 | 3.45 | + | 0.03 | 3.42 | + | 0.39 | 3.51 | + | 0.32 |
| 4 | Ca(Acetate)2 | 12.39 | 0.21 | + | 0.04 | 3.54 | + | 0.03 | 3.49 | + | 0.38 | 3.59 | + | 0.36 |
| 5 | CaCO3 | 8.08 | 0.50 | + | 0.08 | 9.85 | + | 0.07 | 9.63 | + | 1.00 | 9.88 | + | 1.11 |
The area concentration was adjusted to calculate the concentration on the active area of the membrane for all experiments except experiment 1, CaCl2. The other experiments show a Ca concentration on the membrane increasing from SO4 to Acetate to NO3 to CO3. This differs from the threshold flux experiments where we saw threshold flux increase from NO3 to SO4 to acetate to CO3. Carbonate has the highest threshold flux and the highest Ca concentration.
Table 9. Area Adjusted Digested Results
| Experiment | Active Area (cm2) | 23Na (µg/cm2) | 40Ca (µg/cm2) | 43Ca(µg/cm2) | 44Ca (µg/cm2) | |||||||||
| 2 | Ca(NO3)2 | 4.022 | 0.37 | + | 0.09 | -0.59 | + | 0.01 | 3.07 | + | 0.24 | 3.31 | + | 0.31 |
| 3 | CaSO4 | 4.702 | 0.20 | + | 0.03 | -2.54 | + | 0.03 | 0.54 | + | 0.05 | 0.66 | + | 0.06 |
| 4 | Ca(Acetate)2 | 4.696 | 0.15 | + | 0.07 | -3.28 | + | 0.03 | 0.93 | + | 0.11 | 1.12 | + | 0.10 |
| 5 | CaCO3 | 3.917 | 0.70 | + | 0.14 | 10.46 | + | 0.08 | 13.40 | + | 1.45 | 13.84 | + | 1.39 |
MINTEQ Simulation Results
The equilibrium state of each feed water was simulated on Visual MINTEQ (MINTEQ). The distribution of Ca can be seen in Figure 8. The majority of Ca is free in these systems with varying degrees of ion pairing. The SO4 experiment has the highest percent of ion pairing (~25%) and the other systems have Ca ion pairing below 10%. The percent of organic bound Ca is below ~0.4% for each experiment and is barely visible at the top of Figure 8.
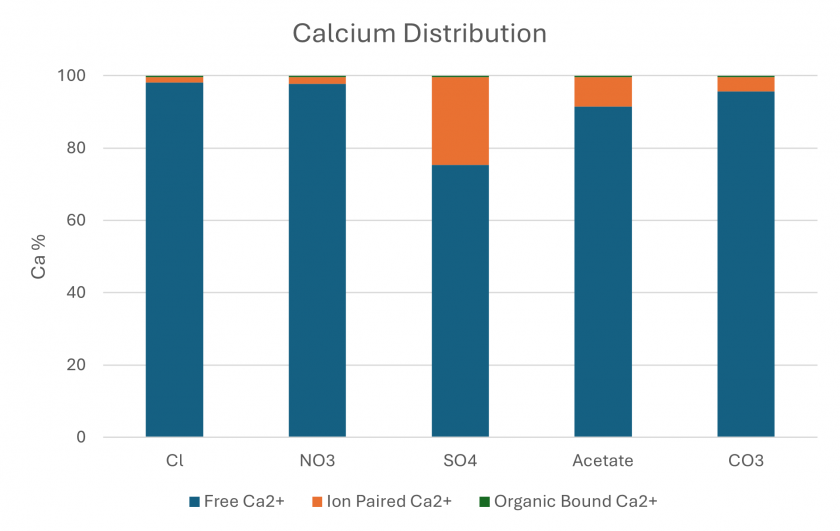
Figure 8. Minteq simulation output showing the distribution of Ca in the system for each simulated feed.
The percent of Ca interacting with the organic matter is shown in Figure 9. Less than 0.4% of the total Ca binds with the organic matter even though these interactions are the primary driver of fouling in this system.
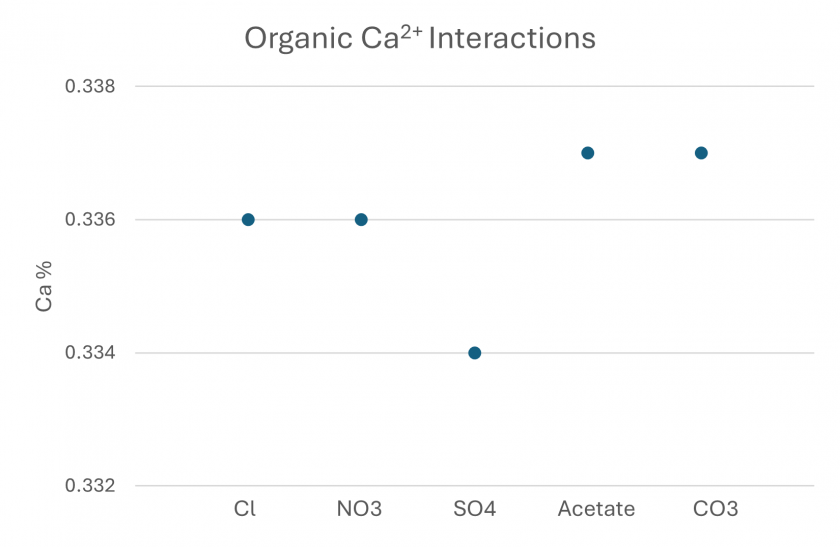
Figure 9. Minteq simulation output showing the amount of Ca interacting with organic constituents for each simulated feed water.
The MINTEQ simulations agree with the experimental ICP MS results that show higher calcium concentrations in the fouing layer for carbonate and acetate, and lower concentrations for sulfate.
Based off Figures 8 and 9 one could predict that the SO4 would have the highest threshold flux because of the fewer Ca organic interactions. While this trend exists for Cl, NO3, and SO4, the acetate and CO3 experiments vary from this trend with each of these experiments having the most Ca organic interactions (0.338%) and the highest threshold fluxes.
The organic interactions on MINTEQ can be analyzed further with the percent of Ca interacting with humic and fulvic gel and carboxylic groups. The percent of Ca carboxylic interactions do not change from experiment to experiment, but the gel interactions decrease for SO4 and increase for acetate and CO3.
Table 10. Percent of Calcium interacting with Organic Fractions
| Experiment | 1 | 2 | 3 | 4 | 5 |
| Salt | CaCl2 | Ca(NO3)2 | CaSO4 | Ca(Acetate)2 | CaCO3 |
| Fulvic Gel | 0.083 | 0.083 | 0.082 | 0.083 | 0.083 |
| Humic Gel | 0.185 | 0.185 | 0.184 | 0.186 | 0.186 |
| Fulvic Carboxylic | 0.013 | 0.013 | 0.013 | 0.013 | 0.013 |
| Humic Carboxylic | 0.055 | 0.055 | 0.055 | 0.055 | 0.055 |
The simulation results also show the percentage of interactions from the organics perspective. These results show that for the gel interacts only with Ca except for the CO3 experiment where the gel interacts Ca and the Ca+anion ion pair.
Table 11. Calcium and Gel Interactions
| Experiement | 1 | 2 | 3 | 4 | 5 |
| Salt | CaCl2 | Ca(NO3)2 | CaSO4 | Ca(Acetate)2 | CaCO3 |
| Fulvic Gel | 100 | 100 | 100 | 100 | 99.896 |
| Fulvic Gel + Anion | 0 | 0 | 0 | 0 | 0.141 |
| Humic Gel | 100 | 100 | 100 | 100 | 99.896 |
| Humic Gel + Anion | 0 | 0 | 0 | 0 | 0.145 |
The thermodynamic stability between the organic matter and the Ca anion in the CO3 experiment allows the anion to impede Ca bridging more effectively than the other anions.