Methodology
Fouling experiments
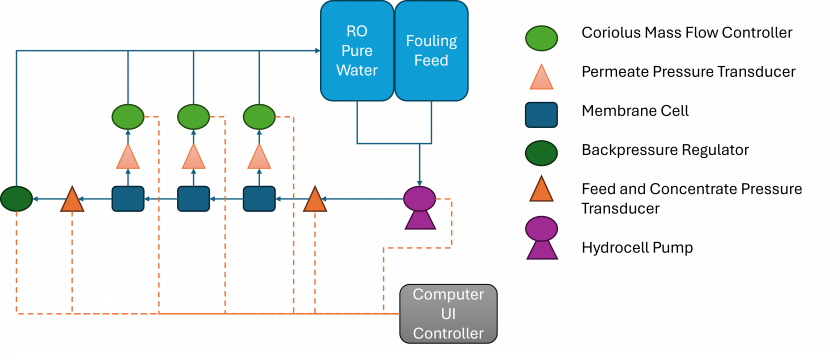
Figure 1. Constant flux fouling system for Ultrafiltration membranes with recirculating feed.
A series of flux stepping experiments with Calcium, Suwannee River Natural Organic Matter (SNOM) purchased from the International Humic Substances Society (IHSS), and varying anions were carried out on Polysulfone (PS) ultrafiltration membranes using the ultrafiltration system shown in Figure 1. During the experiment, the back pressure regulator maintains 30 psi in the concentrate. A constant flux of 10 liters per meter2 per hour (LMH) is achieved with pure water before switching to the fouling feed. The flux is then increased by 10 LMH every 15 minutes until a final flux step of 170 LMH is achieved. As flux increases a pressure drop is observed across the membrane the permeate and the concentrate increases as foulants adhere to the membrane’s surface. The change in pressure difference as flux increases can be used to determine the threshold flux, the flux at which a cake layer forms, for the given membrane and water chemistries. For each experiment, 2 liters of feed solution were prepared and the water chemistry of the feed solutions are shown in Table 1. The pH of the feed solutions were kept at pH 7+0.5 throughout the experiment by adding HCl and/or NaOH. Samples of the feed solution were taken before and after each fouling experiment, and membrane samples were collected for further surface analysis.
Table 1. Feed Water Chemistry
| Experiment | Salt | Salt Concentration (mM) | SNOM (mg C/L) | pH |
| 1 | CaCl2 | 5 | 5 | 7 |
| 2 | Ca(NO3)2 | 5 | 5 | 7 |
| 3 | CaSO4 | 5 | 5 | 7 |
| 4 | Ca(Acetate)2 | 5 | 5 | 7 |
| 5 | CaCO3 | 5 | 5 | 7 |
Microwave digestion
Fouled membrane samples were prepared via microwave assisted digestion for ICP-MS with an ETHOS UPTM (from Milestone). The total area of the digested sample and the area of the fouled portion were calculated using ImageJ software.
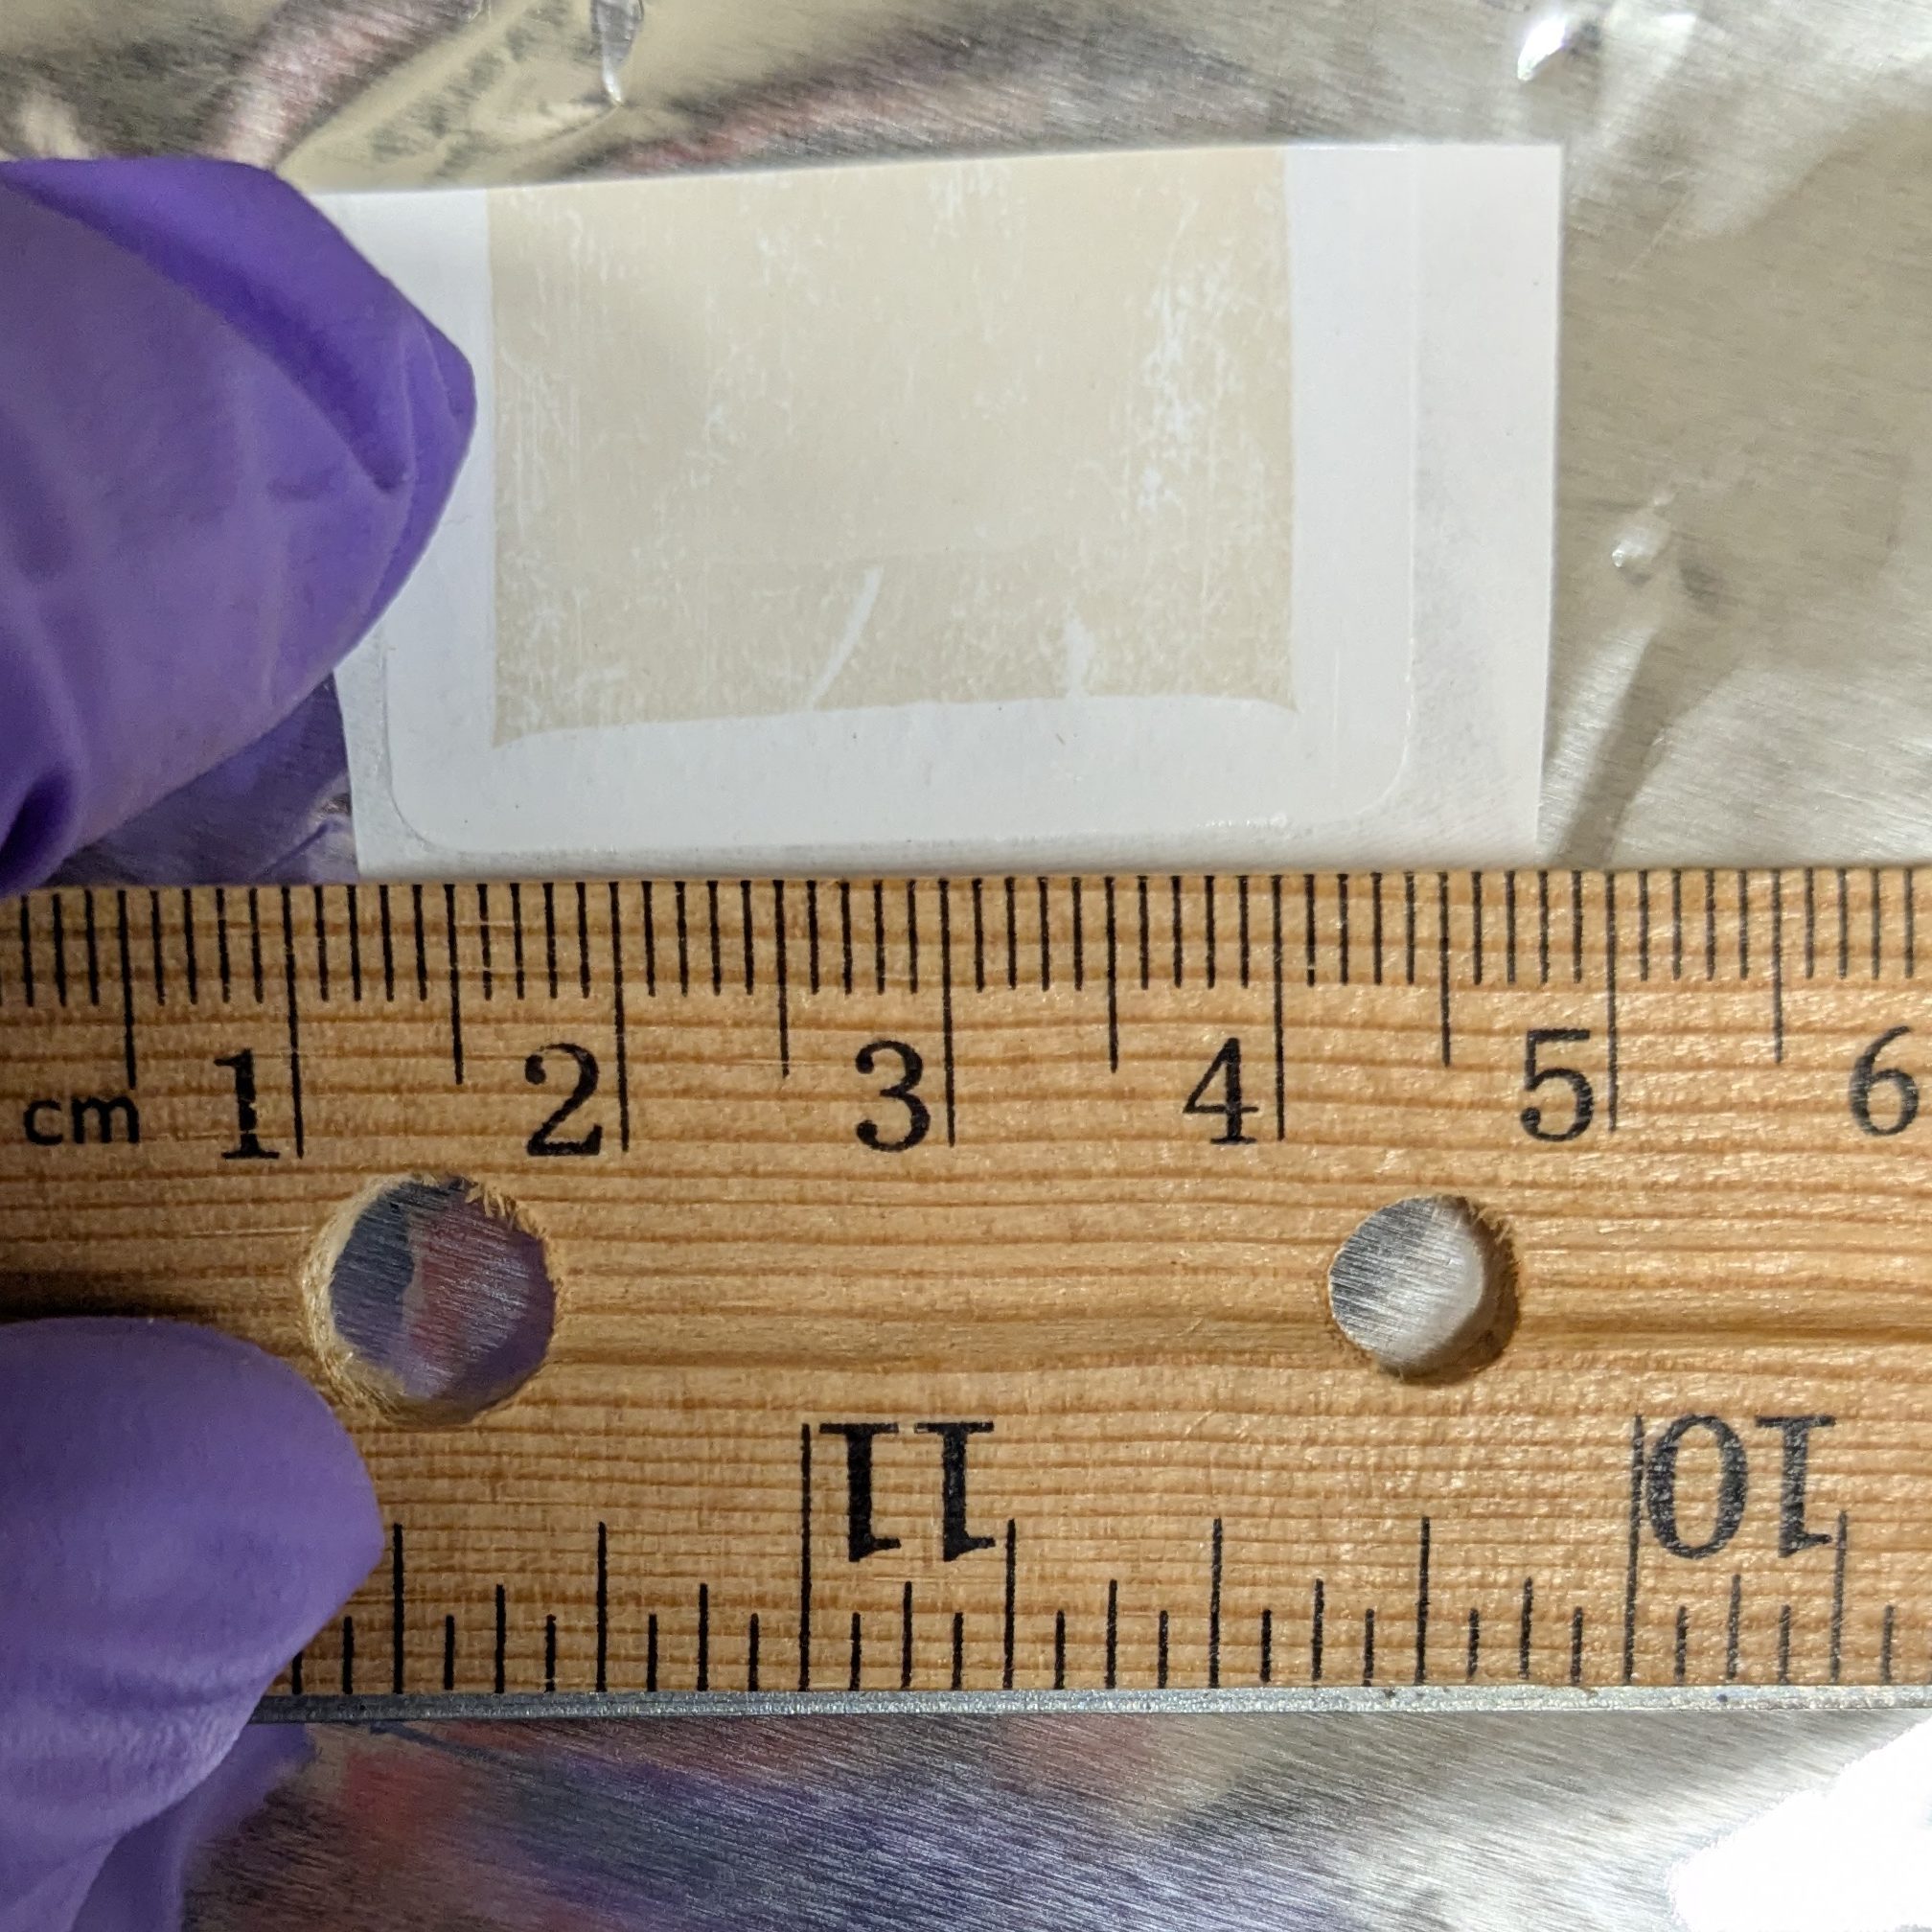
Figure 2. PS membrane fouled with a feed of SNOM CaCl2
The membrane samples and 10 ml of concentrated trace metal grade nitric acid (purchased from Bruker) were sealed in microwave vessels and placed in the digestor. The microwave digestor ramped up to 215°C for 15 minutes, maintained temperature and pressure for an additional 10 minutes, and then was allowed to cool to room temperature before the samples were diluted to 100+0.5 ml with Milli-Q® water.
Instrument Parameters
Cation concentrations (Na and Ca) were determined using an Agilent 7500ce ICPMS at the University of Texas at Austin. (Dept. of Geological Sciences). The instrument was optimized for sensitivity across the AMU range, while minimizing oxide production (< 1.5%). The analytical method employed an octopol reaction system (ORS), operated in no gas and hydrogen (reaction-mode) for the removal of matrix interferences. Internal standards, mixed into unknowns via in-run pumping, were used to compensate for instrumental drift and internal standard sensitivity variations were well within QA tolerances (± 50%). The sequence ran 3 blanks before the calibration curve was measured and checked for linearity. Immediately following the calibration standards, a set of 7 blanks and the first QC set were run followed by another blank. The feed samples were run and a spike was measured immediately following these samples. Next a blank and a second QC check were analyzed. Then the digested samples were analyzed followed by a digested sample spike.
Table 2. ICP-MS operating conditions and insturment parameters
ICP-MS Instrument Agilent 7500ce ICP-Q-MS
Plasma Conditions
- Nebulizer PFE microflow with 90 µL/min uptake rate
- Nebulizer pump (rps) 0.2
- Spray Chamber Scott-type (quartz) with Peltier cooling (2°C)
- Sampling Depth (mm) 8.0
- RF Power (W) 1600
- RF Matching (V) 1.70
- Carrier Gas Flow (L/min) 0.85
- Make-up Gas Flow (L/min) 0.35
Cones Ni
Reaction Cell (ORS) modes and Masses measured
- H2 mode (5.0 ml/min) 40, 45, 72
- No Gas mode 23, 43, 44, 45, 72
- Internal stds 45, 72
Detection System Dual stage (pulse & analog) discrete dynode electron multiplier
Data Acquisition
- Scan mode: Peak hopping
- Points across peak 3
- Integration per mass (sec) 0.1000
- Replicates 3
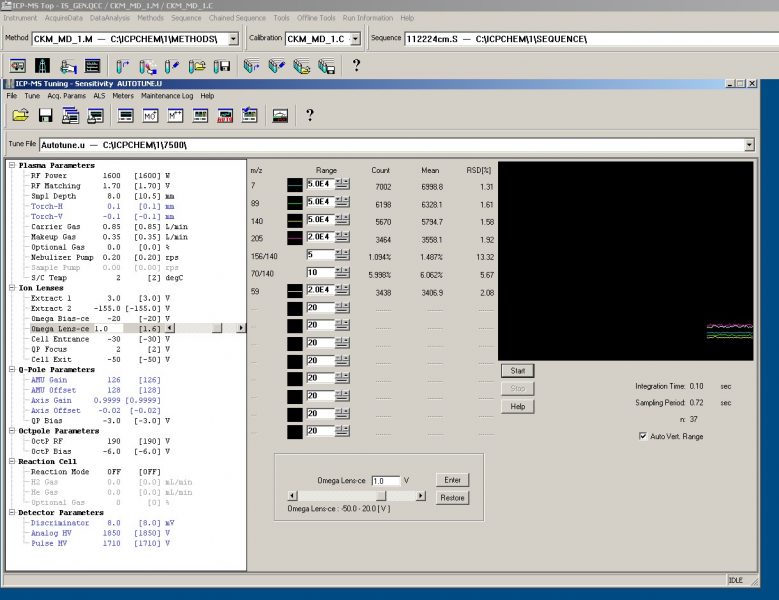
Figure 3. No Gas Tune shows low oxide and doubly charged ion production as seen by the low ~1.5% ratio of Ce140O16 to Ce (m/z 156:140) and ~6% ratio of doubly to singly charged Ce140 (m/z 70:140). The doubly charged signal does not decreases as much as the oxide signal due to interference with diatomic Cl35.
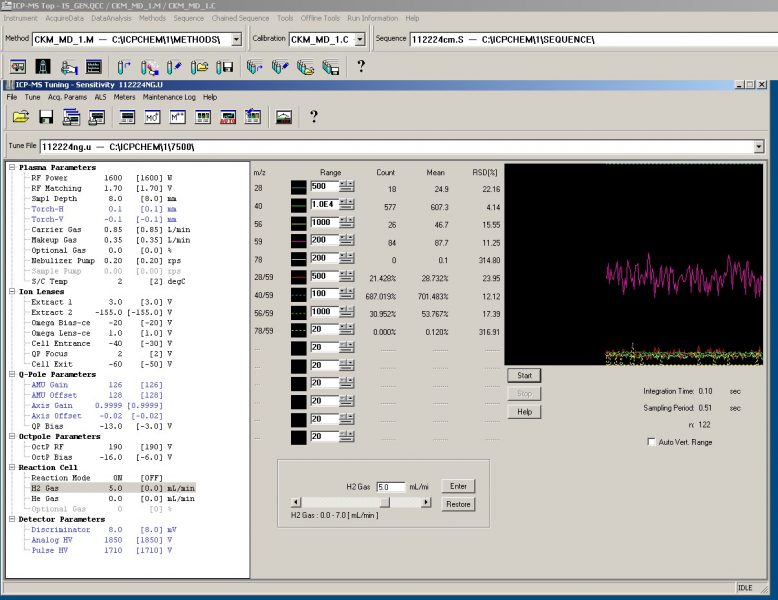
Figure 4. H2 Gas Tune shows low matrix effects with a relatively low Ar40 signal and extremely low diatomic N14 (m/z 28) and Ar40O16 polyatomic (m/z 56) signals, and a nonexistent diatomic Ar40Ar38 (m/z 78) signal while generating an acceptable signal of Cobalt (m/z 59).
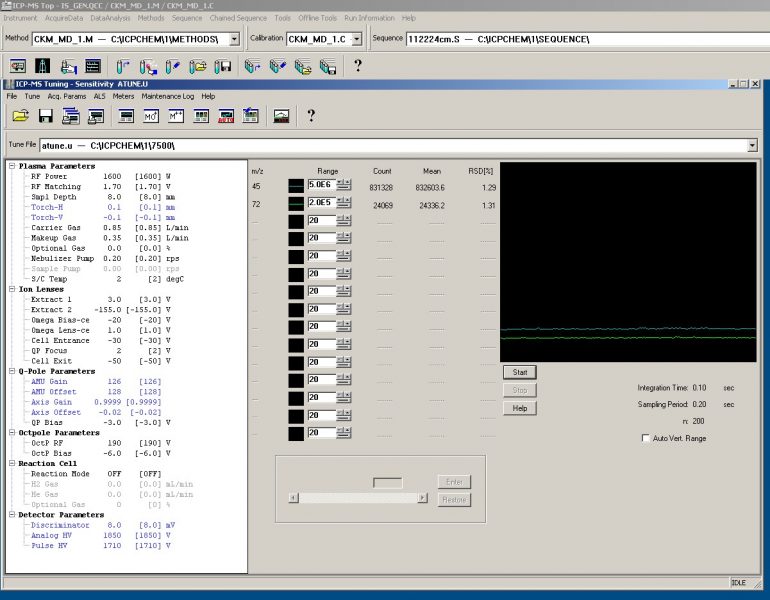
Figure 5. Internal Standard Stability for Sc45 and Ge72. These elements were chosen for the internal standards due to their similar atomic masses to the elements of interest in this study.