Proposal
Abstract
Rare earth elements (REEs), including the lanthanides, yttrium (Y), and scandium (Sc), share similar chemical behavior due to their filled outer electron shells. In natural waters, REEs commonly form complexes with ligands. In seawater, carbonates are the dominant ligands, and the stability of these complexes increases with atomic number. Heavier REEs (HREEs) form more stable carbonate complexes than lighter REEs (LREEs). As a result, LREEs tend to adsorb onto particles and are more readily removed from the water column, leading to HREE enrichment and a negative Ce anomaly—features typical of carbonate and seawater REE patterns (Johannesson et al. 2011)
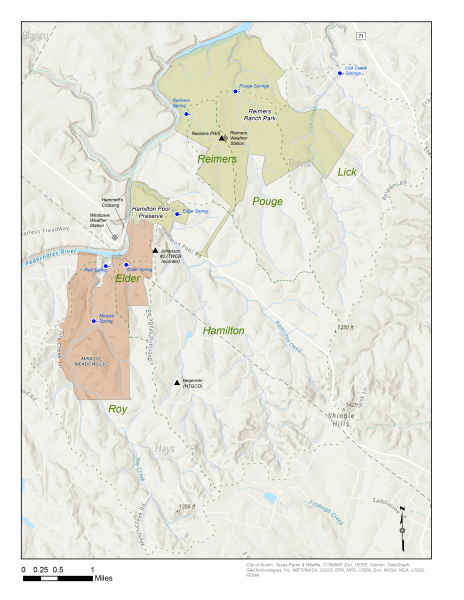
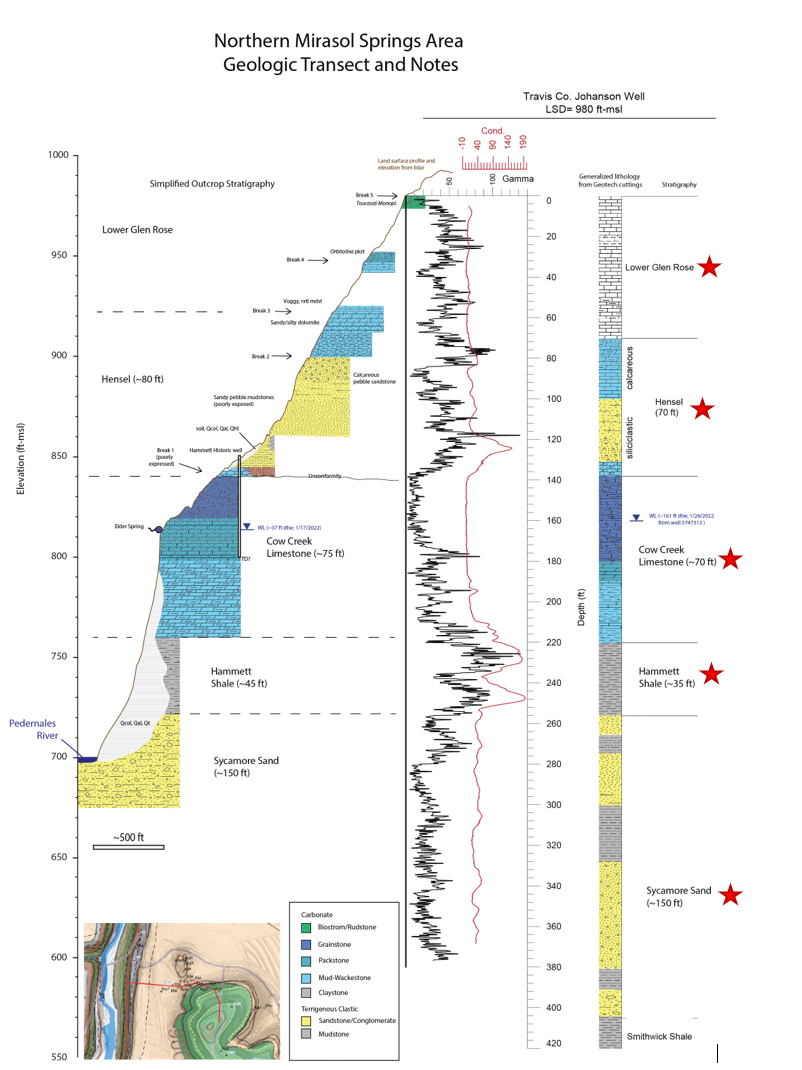
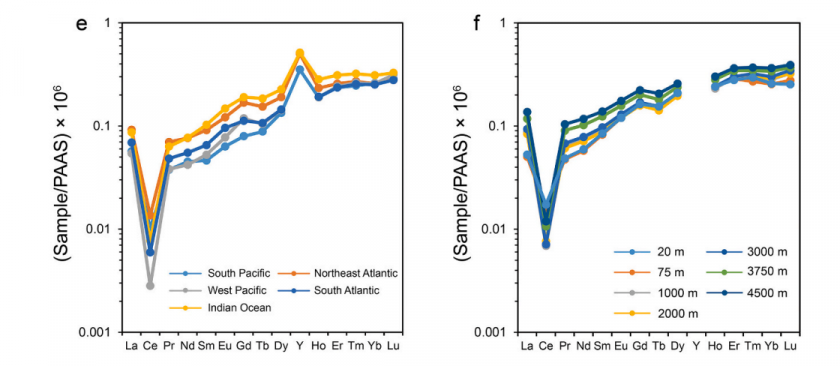
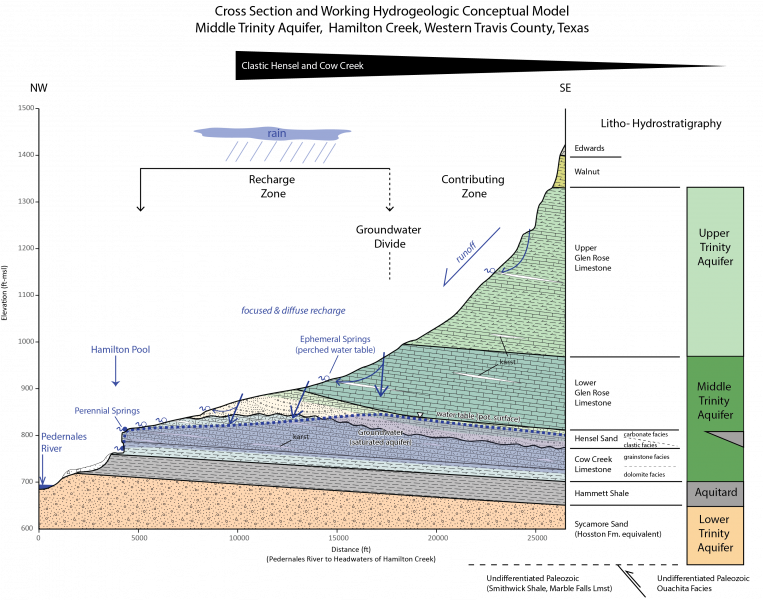
REE patterns compare element concentrations to a standard, usually plotted on a log-scale against atomic number. Shale composites like the North American Shale Composite (NASC) and the Post Archean Australian Shale (PAAS) are common standards (Rétif et al. 2023). These patterns help trace geochemical processes in different environments. In the area of interest of the Hill Country (Figure 1), bedrock is mainly comprised of thick beds of Cretaceous marine limestones, particularly the Glen Rose and Cow Creek limestones (Figure 2). These carbonates likely reflect HREE enrichment and a negative Ce anomaly, similar to seawater (Bellanca 1997; Figure 3). However, the region also includes thinner stratigraphic units with greater clastic continental components, including the Sycamore/Hosston Sand, Hensel Sand, and Hammett Shale. The sandstones are calcite-cemented and have clasts eroded from the Llano Uplift. They may show flatter REE patterns with a negative Eu anomaly and slight enrichment in LREEs, reflecting more continental input (Wani 2017, Barker & Reed 2009, Ecker & Korkmaz 2011). The siliceous shales, also weathered from the uplift, may display a similar patterns to the sandstones. The REE patterns from each geologic unit may be useful for tracing the movement of groundwater through the local aquifers: the Middle and Lower Trinity aquifers (Figure 3).
Hypothesis
Tuning an ICP-MS to have low cerium oxide (CeO) production significantly reduces oxide and hydroxide spectral interferences during rare earth element REE analysis. This tuning method sends a solution of cerium through the machine, where it forms CeO bonds in the plasma. The CeO bond is much stronger than most other oxide bonds, making it difficult to break. Lowering the carrier gas flow rate can limit the formation of, or help break apart, molecules (including oxides and hydroxides) more effectively. Therefore, lowering the carrier gas rate should decrease MO+ and MOH+ spectral interferences (a ‘low MO+/MOH+ production tune’) whereas increasing the carrier gas rate would increases these interferences (a ‘high MO+/MOH+ production tune’). The production of CeO in the plasma can be monitored by with the ratio of the signal created at mass 156 (CeO+) vs the signal at mass 140 (Ce+). A low oxide tune would produce a low 156/140 (CeO/Ce) ratio (generally around 1%), whereas the high oxide tune would show a high ratio (above 2%).
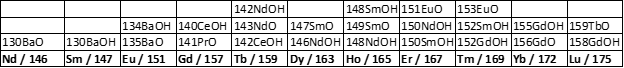
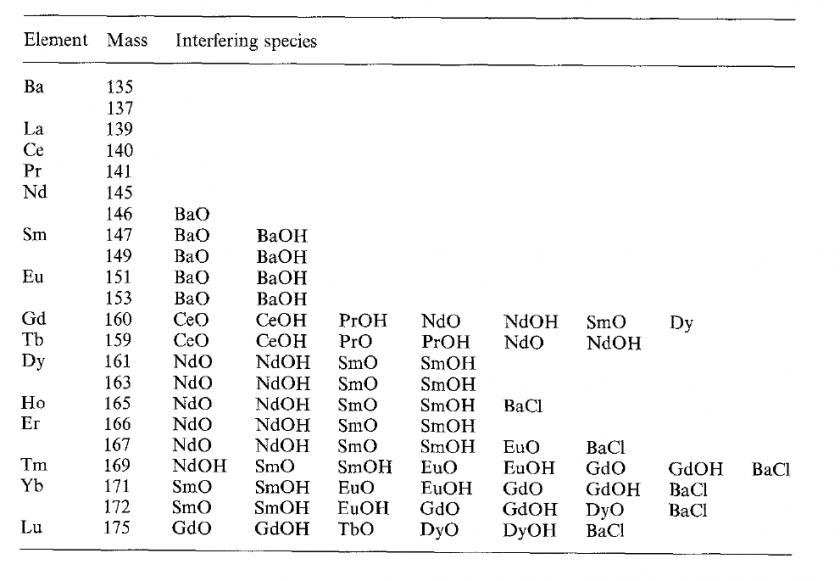
After tuning the instrument, the oxide production conditions remain the same through the entire analytical run. This is important because many REEs form similar oxide or hydroxide species (e.g., NdO⁺, SmO⁺), which can overlap with heavier REE signals (Table 1). By analyzing single element standards of these REEs and Ba, the oxide production ratios created by these elements can be calculated, and the oxide signal can be removed from interfered elements. For example, analyzing a pure solution of Ba will produce a Ba+ signal at m/z 137 and a BaO+ signal at m/z 153. The ratio of these intensities signals (153/137) is the oxide production ratio of BaO+. This ratio can be used to calculate the BaO+ interference intensity on 153Eu, that must be subtracted to derive the un-interfered intensity of 153Eu. Minimizing CeO production means that fewer oxide interferences are present across the mass spectrum, resulting in cleaner, more accurate measurements.
Purpose/Significance
This project can support my master’s research on groundwater chemistry in the Hill Country of Central Texas by helping identify the sources of dissolved ions and evaluating whether mixing occurs between waters from different geologic units. REEs could be effective tracers in this setting because the different sedimentary rock units in the study are likely to have distinct NASC-normalized REE patterns. These distinct patterns can be useful for interpreting groundwater-rock interactions and mixing processes (Johannesson & Zhou, 1999; Sholkovitz, 1995).
The stratigraphy in the study area includes, from youngest to oldest: the Lower Glen Rose Limestone, Hensel Sand, Cow Creek Limestone, Hammett Shale, and Sycamore Sand (Figure 2). When normalized to the NASC, limestone units are likely to show heavy REE enrichment and a negative Ce anomaly (Bellanca 1997). Sandstone and shale units are clastic and may reflect REE patterns found in their parent material from the Llano uplift, meaning they would show a relatively flat line with a negative Eu anomaly and possibly enrichment in light REEs (Wani 2017, Barker & Reed 2009, Ecker & Korkmaz 2011).
Groundwater in the study area flows through the Lower and Middle Trinity aquifers. The Lower Trinity aquifer resides in the Sycamore Sand, while the Middle Trinity aquifer spans the Cow Creek Limestone, Hensel Sand, and Lower Glen Rose (Figure 4). As groundwater interacts with these formations, it acquires REE signatures characteristic of the host rock. For instance, groundwater sourced from the Sycamore may show LREE enrichment and a negative Eu anomaly, whereas water from the Cow Creek may exhibit HREE enrichment and a negative Ce anomaly. Overall, REE analysis can be a helpful tool for groundwater tracing if REE concentrations are analyzed in the future.
This project will also determine the significance of instrument tuning on resulting MO+ and MOH+ production rates. Analyzing samples separately with a high oxide production tune and low oxide production tune will allow me to calculate the resulting REE MO+ and MOH+ production rates on each interfered REE. These rates can be compared against one another to provide a quantitative evaluation of the effectiveness of a low oxide tune vs a high oxide tune. It will also indicate how these oxide production rates affect the measured intensities signals and corrected concentrations of the same set of samples.
Literature Review
Removal of MO+ and MOH+ interferences on REE isotopes is a significant challenge for REE analysis by ICP-MS. Previous methods have been developed to mitigate these interferences. The main approach (Dulski 1994, Negrel et al., 2000) involves using single element solutions of Ba and LREEs (Ce, Pr, Nd, Sm, Eu, Gd, Tb) to establish proxies for M-oxide and/or M-hydroxide production that, during data processing, can be subtracted from measured (interfered) intensities of REE analyte isotopes to derive uninterferred “true” REE intensities that are proportional to concentration. Some REE isotopes have fewer potential interferences than others, making them more attractive analytes to simplify this approach. As shown in Table 2 (from Dulski 1994), analytes below m/z 146 are free from oxide and hydroxide interferences, m/z 146 has one potential oxide interference, and m/z 147-175 have multiple potential oxide and/or hydroxide interferences. I followed the approach of Negrel et al. (2000), who measured 139La, 140Ce, 141Pr, 146Nd, 147Sm, 151Eu, 157Gd, 159Tb, 163Dy, 165Ho, 167Er, 169Tm, 172Yb, and 175Lu in samples, following measurement of single element solutions of Ba, Ce, Pr, Nd, Sm, Eu, Gd, and Tb, measured at the same masses (Ba was measured at m/z 135 and 137). Interferences from molecules containing 17O and 18O isotopes can generally be ignored (and will be for this study) due to their low abundance (Dulski 1994). Similarly, DyO+ and DyOH+ interferences on 172Yb and 175Lu can be ignored because they Dy isotopes have extremely low natural abundances.
Finally, instrumental tuning can be used to decrease the oxide signal on REEs. It is generally accepted that tuning the instrument to have a low CeO/Ce ratio is preferred because it can decrease polyatomic interference signals (McCurdy 2019).
Materials and Methods
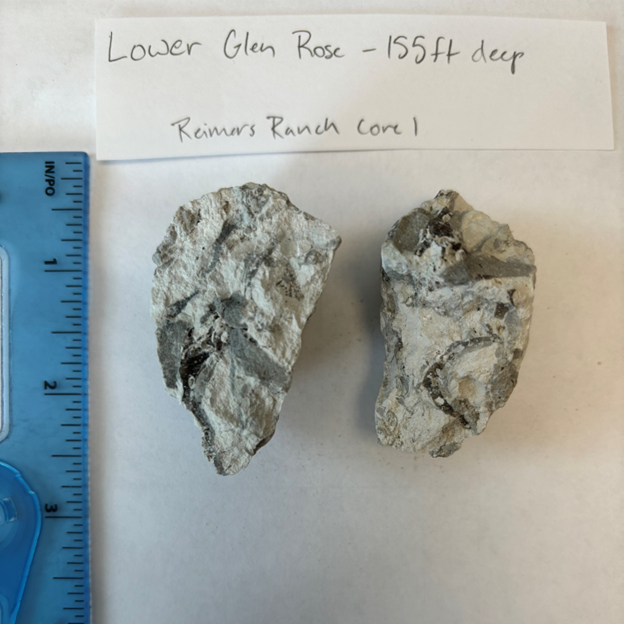
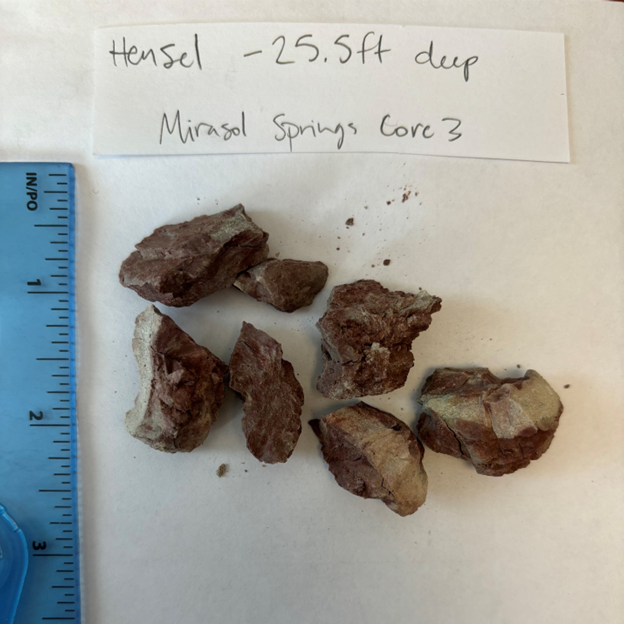
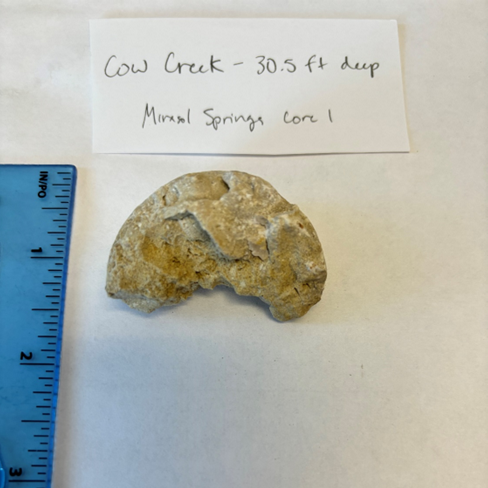
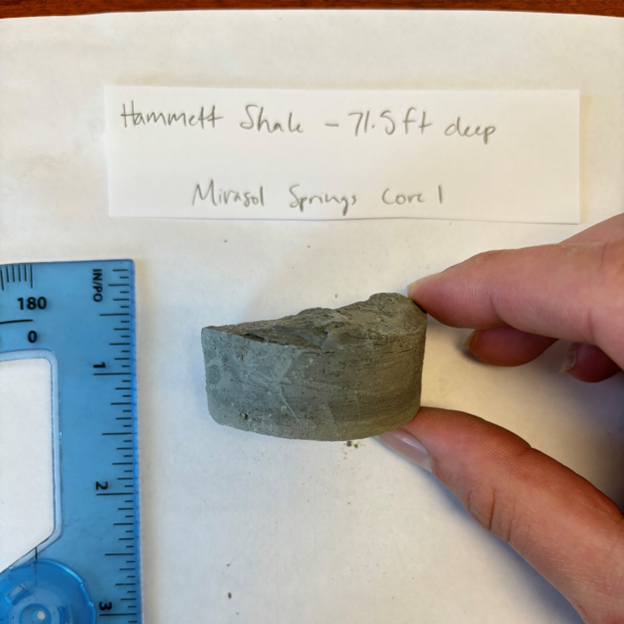
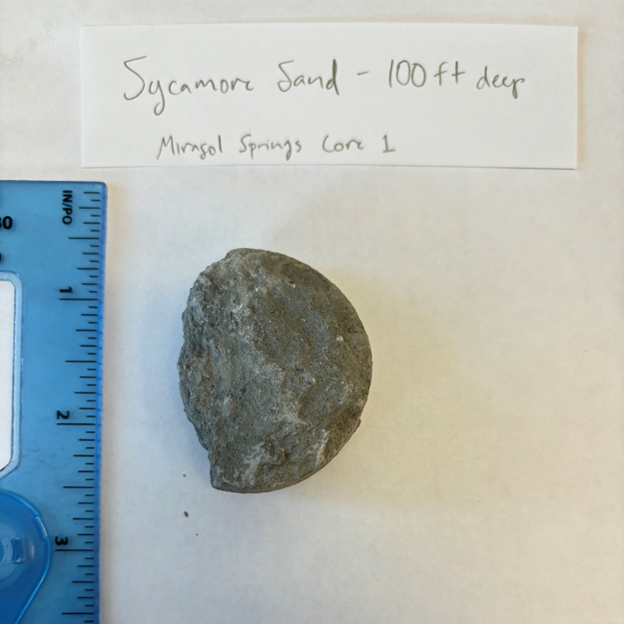
One rock fragment from each of the geologic units will be analyzed (Lower Glen Rose Limestone, Hensel Sandstone, Cow Creek Limestone, Hammett Shale, Sycamore/Hosston Sandstone; Figures 6-10). These rock fragments were collected from two separate cores, one at Reimer’s Ranch and the other at Mirasol Springs in the Hill Country. Samples may not be completely representative of the entire unit.
Each sample will be crushed into a powder and dissolved separately using two methods. One dissolution will isolate the carbonate fraction of the rock, and the other will dissolve the whole rock. Each solution will be diluted to around 200ppm total dissolved solids using 3M nitric acid. Laboratory blanks, internal standards, single element standards, calibration standards and quality control standards will be used to quantify and evaluate data quality.
All REEs will be analyzed, with the least interfered isotope of each REE being selected as the analyte mass (following Negrel et al., 2000). The instrument will be tuned and run at both high and low oxide production rates. Interference equations will be used after instrumental analysis to subtract MO+ and MOH+ intensities from the interfered analyte masses. The corrected intensities will be used to generate calibration curves of intensity vs concentration, from which unknown, blank, and quality control standard concentrations will be extrapolated. Data quality will be assessed for the corrected data for both the high and low oxide production runs.
Discussion/Possible Outcomes
Though it is generally hypothesized that the high oxide tune will produce greater oxide production ratios, and that each lithology will produce specific REE patterns, the results of this project may be more complicated.
High vs Low Oxide Production Tune Concentrations
Expectations: REEs with multiple MO+ and MOH+ interferences are expected to have the highest oxide production ratios than those with just one. The low oxide production tune is anticipated to produce significantly less MO and MOH interference than the high oxide tune. For example, if the CeO/Ce ratio is set to 1% for the low oxide tune and 3% for the high oxide tune, the high oxide tune should generate three times more oxide interference. Despite these differences, the final calculated REE concentrations are expected to remain consistent between runs, since the same samples are being analyzed for each analysis.
Possible Deviations from the Expected Results: Oxide production rates could vary between individual REEs due to differences in concentration. Additionally, the calculated concentrations may differ between tuning conditions, particularly if higher oxide production increases the margin for error during interference correction. Oxide/hydroxide corrections in the low oxide tune could be so minimal that they approach the level of analytical noise, making subtraction counterproductive. Finally, unintended introduction of REEs into the samples during sample preparation could alter results.
REE Patterns
Expectations: Carbonate samples are expected to show a negative Ce anomaly and enrichment in HREEs, reflecting a typical marine signature. In contrast, sandstones and shales are anticipated to exhibit flatter NASC-normalized REE patterns with enrichment in LREEs and a negative Eu anomaly.
Possible Deviations from the Expected Results: Variations in ocean chemistry, temperature, and pH over geological time may create differences in limestone REE patterns compared to other limestones or seawater samples reported in previous studies. Warmer ocean conditions, which were likely present during the deposition of these geologic units, may have suppressed REE adsorption onto carbonate surfaces. Additionally, differences in the adsorption behavior of individual REEs could contribute to variations in the resulting patterns. However, this interpretation is speculative, particularly given that some published studies report minimally altered Mesozoic carbonates with REE signatures resembling modern seawater. Diagenesis, which is not addressed here, may also play a significant role, as diagenetically altered carbonates can exhibit REE patterns that differ markedly from those of primary seawater. Predicting REE behavior in the sandstones and shales is challenging due to their complex depositional histories. The Sycamore Sand may show a mixed carbonate signature due to its carbonate cementation. The Hensel Sand, although classified as a sandstone, contains significant lithologic variability, including clasts from siliceous and carbonate rocks as well as carbonate deposits from marine sources. This heterogeneity could result in a composite REE signal. The Hammett Shale may closely resemble the NASC pattern, with a relatively flat profile and few anomalies. Overall, REE patterns in these stratigraphic units are influenced by multiple factors, limiting predictions.
Time Frame and Budget
| Date | Accomplishment |
| September 2024 | Proposal |
| October 2024 | Collect samples |
| November 2024 | Prep samples |
| December 2024 | Run and analyze samples |
| May 2025 | Complete project |
Table 3: Time frame of project
| Analyte | Number (for 2 instrument runs) | Cost ($20/analyte) |
| Instrument Blanks | 24 | $480 |
| REE Calibration Standards | 10 | $200 |
| Ba Calibration Standards | 10 | $200 |
| QC Standards | 6 | $120 |
| Single Element Standards | 16 | $320 |
| Method Blanks | 4 | $80 |
| Samples | 20 | $400 |
| Total | 90 | $1,800 |
Table 4: Projected cost of project. Each analysis costs $20. The number of analytes was multiplied by two because the analysis will be completed twice: once with the low oxide tune and once with the high oxide tune.