Discussion/Major Findings
Method Development
The purpose of this study as proposed was to attempt to determine whether or not the amphiboles found in the three types of samples collected from three locations on the slopes of Mt. Vesuvius were crystallized from the same magma reservoir. A LA-ICP-MS method was developed in order to find the trace element signatures for these amphiboles which act as a fingerprint for their origin. Initially, the plan was to only focus on light rare earth elements including Sc and Y since those are reported to partition preferentially into the crystal amphibole as opposed to the melt during partial crystallization. However, the final method conducted analysis on the entire REE spectrum in order to plot the patterns for the three sample types just in case there was something interesting to note. After sample prep, the ICP-MS method was created first and the instrument’s parameters were tuned for the elements selected for analysis. Next, the sample were loaded into the laser ablation cell and the spots, lines, and standards were plotted out using the software interface. Then, laser ablation tuning was performed using a line scan on NIST 612 standard and 100µm spots on untouched excess grains for a representative sampling. Finally, the main analysis could get underway. The analysis was split into two separate runs. The first consisted of the spots and lines of spots and lasted approximately 2.5-3 hours. This data makes up the bulk of the relevance for this project as the main objective was to gather as many spots as possible to get a representative average for each sample type (A,B,C). These averages would be used to create plots comparing the types and rare earth patterns to see how similar the amphiboles are to each other. The second run had a duration of about half an hour and consisted of the linear portion of the analysis. The primary purpose of the linear transects were to see if there was any zoning or inclusions which may cause strange occurrences in the data.
Data Analysis
Based on the limits of detection and the recoveries for the secondary external standards seen in Tables 1, 2,3 & 4 on the data quality page, the acquired data was high caliber in accuracy and precision. This likely means that any anomalies are caused by other factors. The two elements that consistently presented issues were Rb and Ba. In table 5 on the results page, the standard deviations for these two elements are higher than the average indicating wild variation in the values. Additionally, many of the uncertainties for these elements are quite high which also indicates this method may not be able to adequately solve the research problem due to unexpected issues. The cause of this will de discussed in the section below. Among the spot data, the B and C grains were more enriched in the rare earths across the entire spectrum however they were less enriched in Sc compared to the A grains.
Findings
The figure below shows a comparison of the average concentration for the three samples types. All three have Sc values slightly less than 200 ppm however A’s value is elevated compared to B and C. As for Y, type A has a concentration of <50 ppm while type B and C are just below 60 ppm. This enrichment of elements in B and C aligns well with the overall enrichment of types B and C in trace elements generally. It is possible that A has a true value that better matches the other two types due to some potential errors and anomalies in the process. Rb and Ba are not included here due to being too unreliable.
Figure 1: Average Concentration for Sample Types of Sc and Y
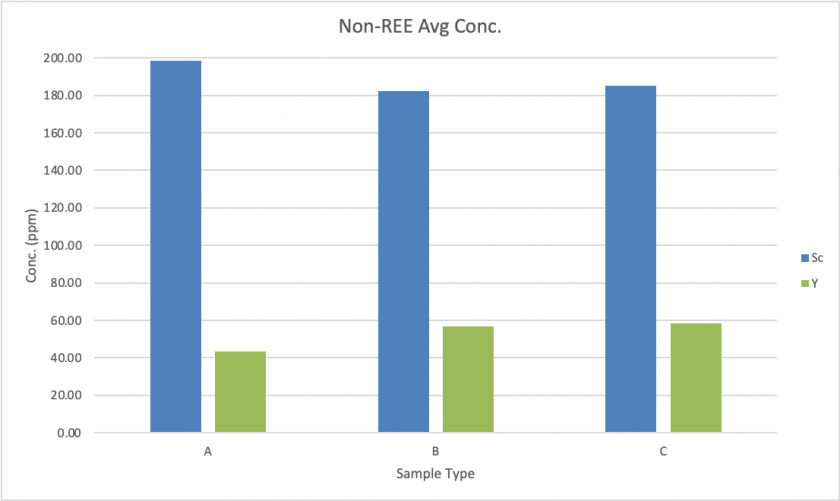
Figure 2 shows the rare earth patterns for the three sample types based on the average concentration in ppm. The average values for concentration were normalized to chondrite values provided by McDonough and Sun (1995, https://meteorites.wustl.edu/goodstuff/ree-chon.htm). Once again, types B and C are more enriched in the rare earth elements across the board than type A. Interesting to note is that the high concentration rare earths for B and C are distinctively higher and has a sharper peak while the lower concentration rare earths fall closer to A. The overall pattern has an increasing curve for element La, Ce, and Pr until the concentration peaks at Nd before beginning to abruptly drop off at Eu. From the element Gd, the higher REEs progressively decrease as atomic number increases. Despite the differences in concentration all three sample types display the same pattern meaning they all likely originate from the same magma reservoir at depth.
Figure 2: Rare Earth Patterns for Sample Types Normalized to Chondrite Values
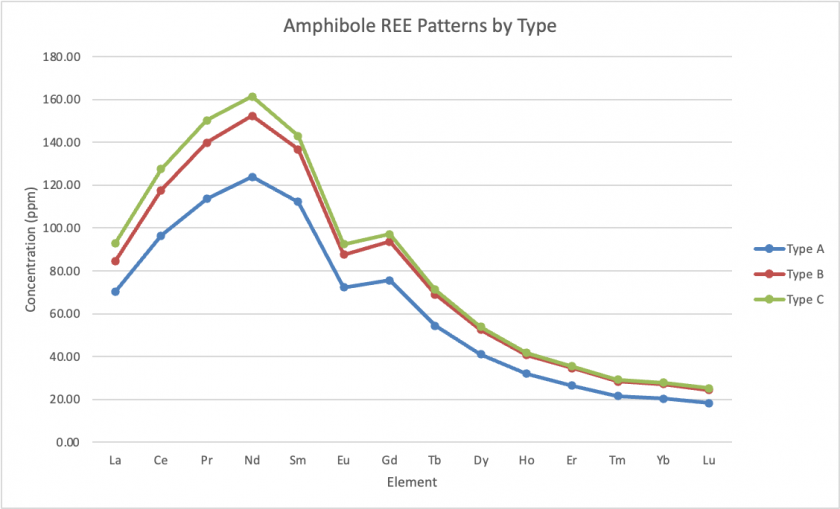
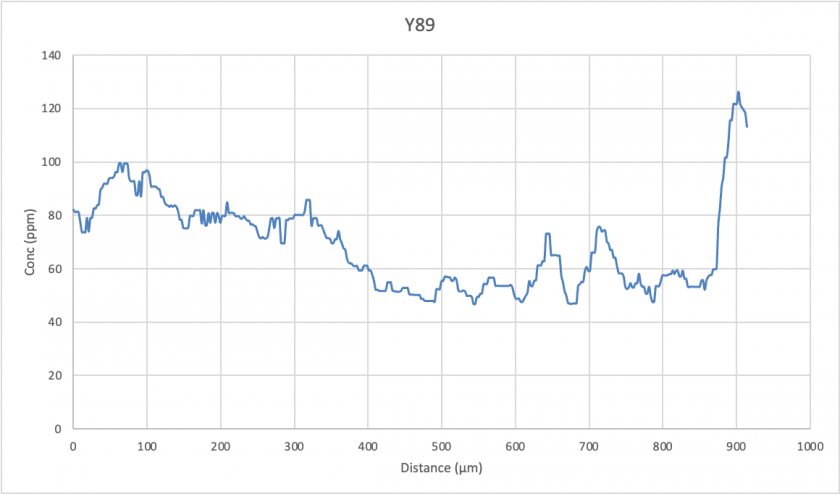
Figure 3 below shows one of the type A linear transects plotted for distance. The values have been normalized using the median here instead of the average for a smoother line. There is a fairly constant value throughout most of the line before there is a sudden large spike in Y that reaches over a thousand ppm. This suggest that there is an inclusion present here that is extremely enriched in Y compared to the rest of the grain which has an overall Y concentration of 100 to <50 ppm. The presence of these highly enriched inclusions was unknown prior to this analysis and it creates problems with the data obtained from this project. Figure 4 shows an example of the more typical variations present within grains via a linear transect of a type B grain. Even with the median smoothing, there is still a lot of changes just in Y concentration across the grain. This suggest that there are likely multiple small inclusions such as the one which causes the spike to 120 ppm at the end of the line.
Figure 3: Y89 Median Concentration Across Linear Transect of Type A Grain
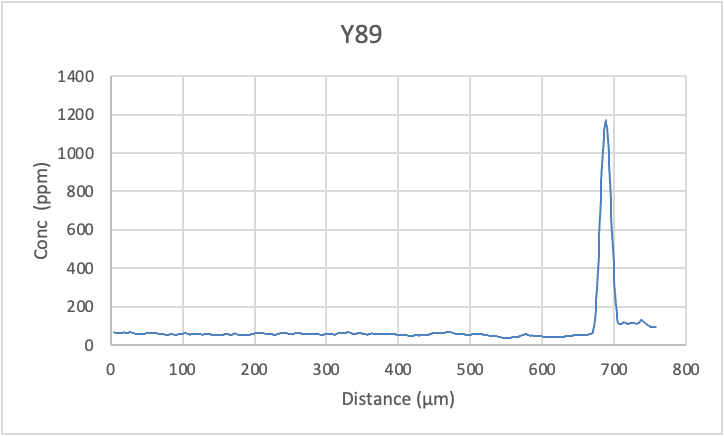
Figure 4: Y89 Median Concentration Across Linear Transect of Type B Grain
Potential Problems & Solutions
The biggest issue this project faces is the unexpected abundance of enriched inclusions present in the amphibole grains. These were not seen before prior to analysis since amphiboles are very dark grains and no EPMA or other in-situ chemical analysis was conducted on these grains prior to this project. Having this initial step would increase the confidence in the results. As it is, while the results of this project suggest that all three samples types have the same origin, the fact that there are numerous inclusions in these samples calls that into question. It is very possible that the inclusions present altered the overall values in the data particularly throwing off the averages. While this probably will not affect the similarity between sample types, the actual values themselves are unreliable despite attempts to avoid obvious inclusions using the Iolite software to edit them out. It would appear that it is simply not possible to eliminate all the inclusions. For a future project like this, it would be advisable to do a more in-depth analysis of the grain beforehand in order to determine potential problems like this. For dark grains in particular, chemical analysis would have helped considerably. This would also provide a better understanding of the exact chemical composition of these amphiboles which would help in determining the internal standard element to use and the reference value used for the data reduction of the unknowns. Having an exact accurate wt% for Si would provide more accurate information.