Results
The averaged concentration and standard deviation of the line of spots for each sample. Zircon samples TN01, TN06, and TN09 are igneous, and TN21 and TN25 are detrital. Igneous samples are stratigraphically higher in the section than the detrital samples.
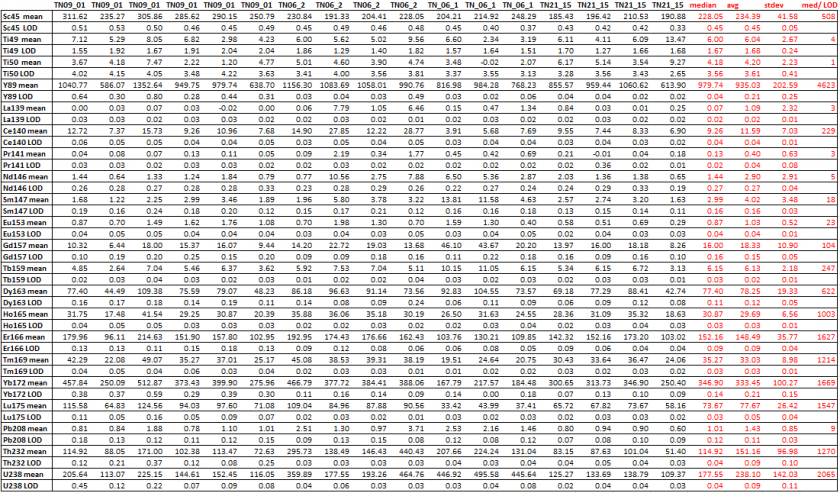
| TN09 | TN06 | TN21 | |
| La/Yb* | 3.67E-05 | 5.38E-03 | 6.40E-04 |
| Eu/Eu* | 0.72 | 0.27 | 0.26 |
The overall Eu/Eu* ratio increases from detrital to igneous samples as you go up stratigraphically. The La/Yb* ratio decreases from detrital to igneous samples as you go up stratigraphically.
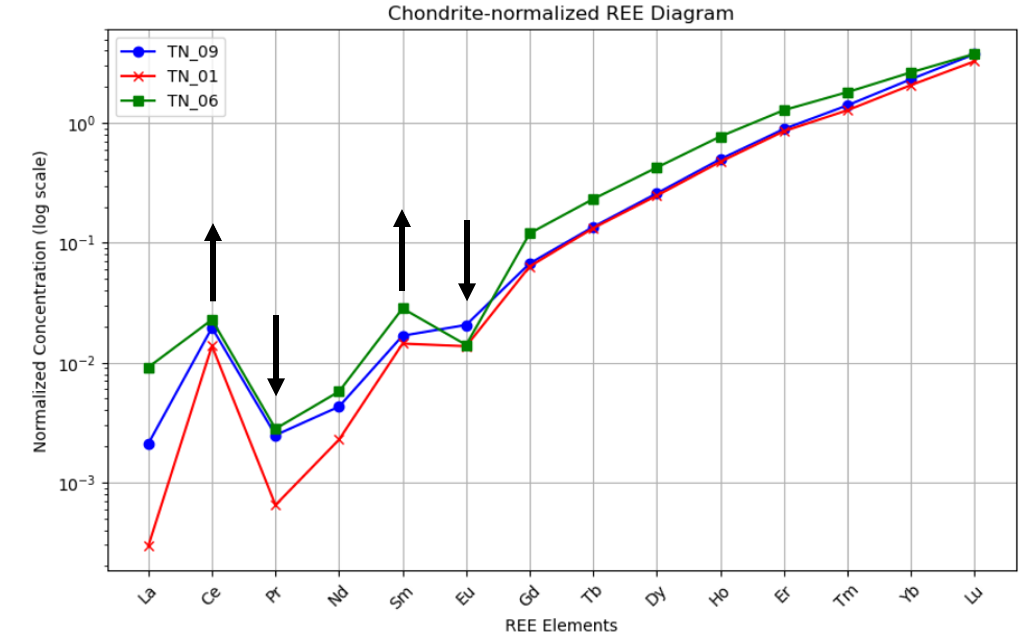
Figure 1. Chondrite-normalized Rare Earth Elements plot of Igneous zircons.
A general trend of REEs increasing with mass is observed along with a Ce anomaly and enrichment in Sm. There is a depletion of La, Pr, and Eu.
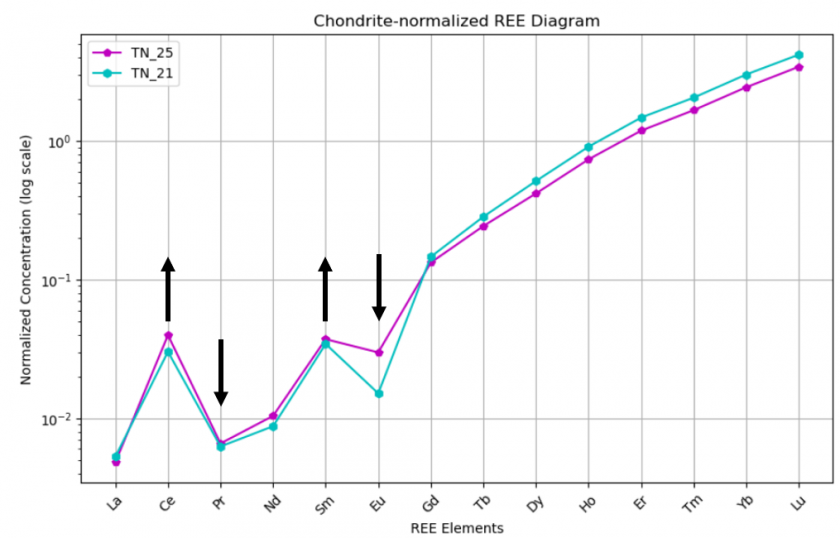
Figure 2. Chondrite-normalized Rare Earth Element plot of detrital zircons
A general trend of REEs increasing with mass is observed along with an enrichment in Ce and, Sm. The depletion of La, Pr, and Eu is observed.