Discussion/Major Findings
Method Development
First, we turned the ICP-MS in solution mode to determine the pulse/analog (P/A) factor across AMU masses 6-238. The sensitivity was sufficient except for Sr (mass 86), which was too low. We then tuned the laser cell to NIST 612 with a 75µm spot, ablation size at 5µm/sec, with a repetition rate of 10 Hz using He and Ar as our carrier gases flowing at 0.8 L/min. The mass fractionation value of U-238/Th-232 was 101.202%, which is close to the optimal condition of 100%. The oxide production was 0.344% for ThO/Th. The calculated sensitivity factor from measuring Pr-141 was 1950cps/ppm (72,902 cps/37.2ppm)
Following the initial tuning of the quadrupole, an initial method was developed on a representative unknown zircon using a time-resolved analysis with the chosen masses with an integration time of 10ms and an initial repetition rate of 10 Hz. Unfortunately, there was high signal variation across our initial standard (Si-29). To combat this, we doubled our integration time (20 ms), which offered a much more stable scan line.
Afterwards, a series of experiments was conducted in order to optimize the laser strength and repetition rate to reduce the signal variation. Following the various experiments, the selection of 80% laser strength and a repetition rate of 20 Hz was made, as these parameters offered a generally stable scan line. However, when conducting the test, the counts for LREES like La, Pr, Nd, Sm, and Eu ranged from 1-25 in the span of 200 seconds. To counteract this, we decided to bump up the integration times from 20ms to 30ms for these masses
Key Findings
The La/Yb* ratio increases in thicker continental crust because LREEs (La) are more enriched relative to HREEs (Yb) during partial melting of the mantle. Higher La/Yb ratios typically indicate thicker or more evolved crust.
Eu/Eu >1*: A positive Eu anomaly indicates that Eu is enriched relative to Sm and Gd. This typically occurs when there is fractional crystallization of minerals like plagioclase feldspar, which preferentially incorporates Eu into its structure, leading to Eu enrichment in the crust. This is often interpreted as thicker crust or crustal differentiation. Eu/Eu <1*: A negative Eu anomaly indicates that Eu is depleted relative to Sm and Gd. This can occur due to partial melting or hydrothermal alteration processes, which lead to the removal of Eu from the sample. This may be indicative of thinner crust or a more depleted mantle.
We expected to see the trends of both the La/Yb* and the Eu/Eu* ratios increasing from the detrital zircon samples collected in the lower stratigraphic sections compared to the higher igneous zircon samples. The La/Yb* ratio cannot be determined credibly as due to the limited detection of La. Although an increasing trend was observed in the Eu/Eu* ratios, it cannot be considered a positive anomaly because the values were <1. Therefore there was depletion of Eu.
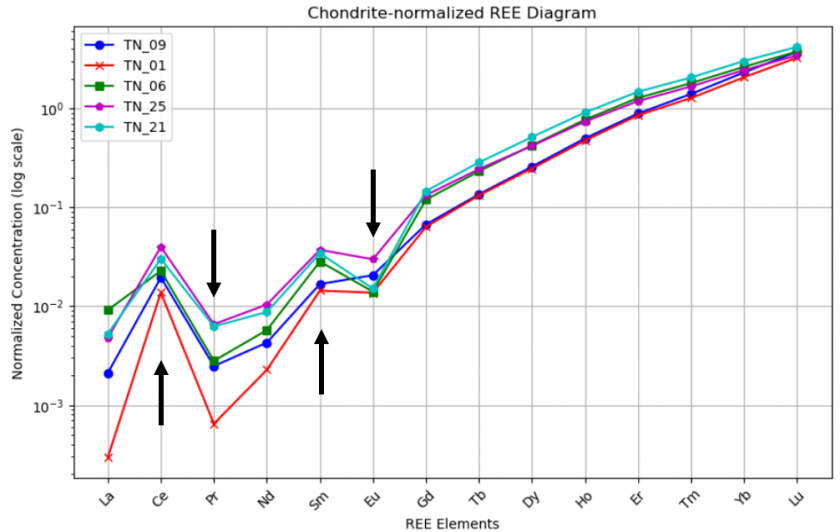
The Cl Chondrite normalized plots of both detrital and Igneous zircons show the overall increasing trend of REEs with the enrichment of Ce and Sm, and the depletion of La and Eu. La was reported to have low detection limits, which supports the trends observed in the REE plots.
Zircon grains were observed to exhibit zoning apparent in images. These zones were observed to have a noticeable impact in CPS (counts per second) for all measured elements. Shown below are 3 examples of zircon grains in which zoning is exhibited along a rim-core-rim transect, highlighted in CPS of U, Th, and Pb.
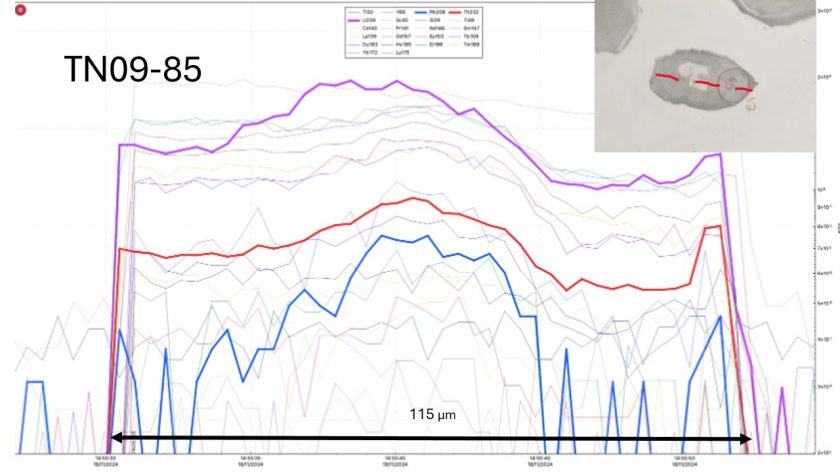
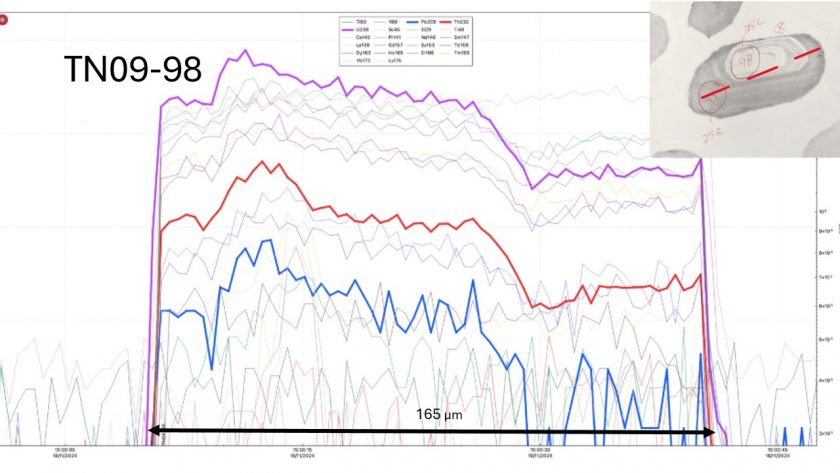
As seen, the CPS of these important geochronometric elements varies tangibly across zones. If using U-Th-Pb to calculate an age of the zircon, this variation will cause multiple age domains to be observed. A variance in trace element count will also be present in other trace element work, such as the Eu/Eu and La/Yb ratios presented in this study. In general, our zircon grains exhibited U-Th-Pb enriched cores and depleted rims. Measured REEs generally followed this trend as well, though some were less exaggerated. This is of utmost importance to consider when determining spot size and placement for analysis of zircon by LA-ICP-MS, and emphasizes the importance of taking high resolution images of your grains beforehand.
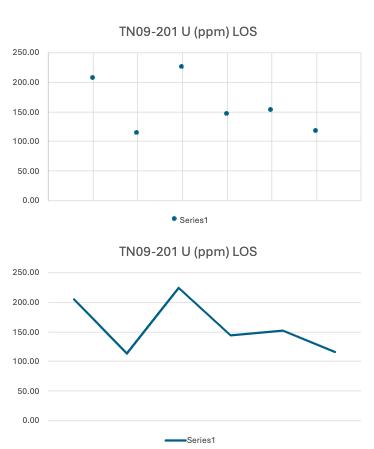
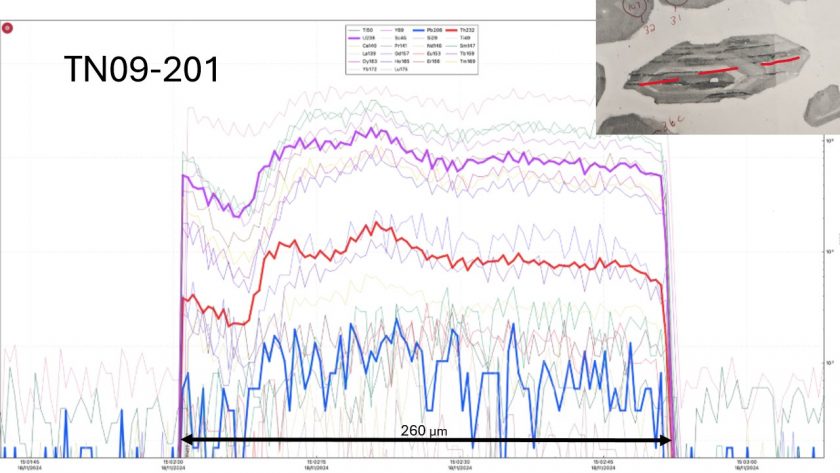
Line of spot data is shown above for sample TN09-201. As seen, a similar trend is observed in U concentration, but in less detail than the line scans. This grain had room for six 30 micron spots, but many only have room for three or four, further reducing resolution. For this reason, lines of spots are not ideal for observing zonation trends in zircon grains.