Data Quality
Standard recoveries of calibration standards NIST610 and NIST612 were compared and used to determine precision and accuracy of data. 6 standards were run with average recoveries of 100% with an uncertainty of 4% (Figure 1). This indicates the data is precise and accurate. Calibration curves fitting gas blanks were created in Iolite. Typical concentrations for line scans were reported and compared to the limit of detection (Figure 2).
- Repeatability: The precision of the measurements was evaluated by repeating analyses of the same sample (or an aliquot of the same sample) in multiple spots. The relative standard deviation (RSD) for replicate analyses was 4.35%, which indicates good precision for most elements.
Background Correction: Background signals were measured and subtracted from the sample data for each element to account for any contamination from the instrument or environment.
Limits of Detection (LOD): The LODs for each element were calculated based on the standard deviation of the background signals and the sensitivity of the instrument. For most element averages for line scans, analytes were typically 10s to 1000s of times higher than limits of detection, except for Ti, La, Pr and Nd.
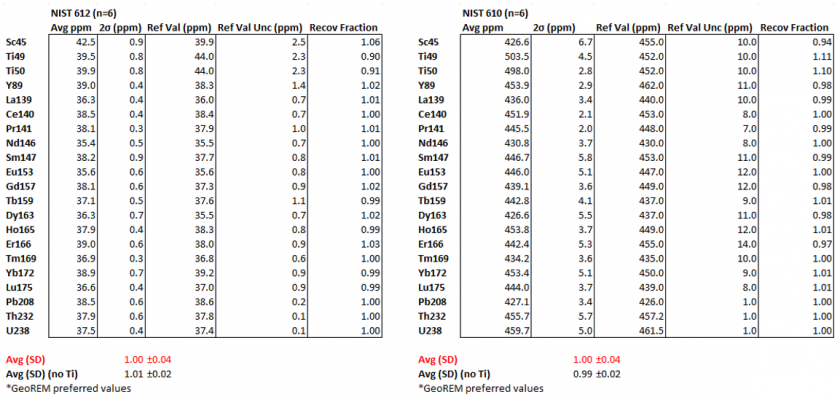
Figure 1. NIST610 (left) NIST 612 (right) GeoREM preferred values used as primary calibration standards to determine recoveries of external references.
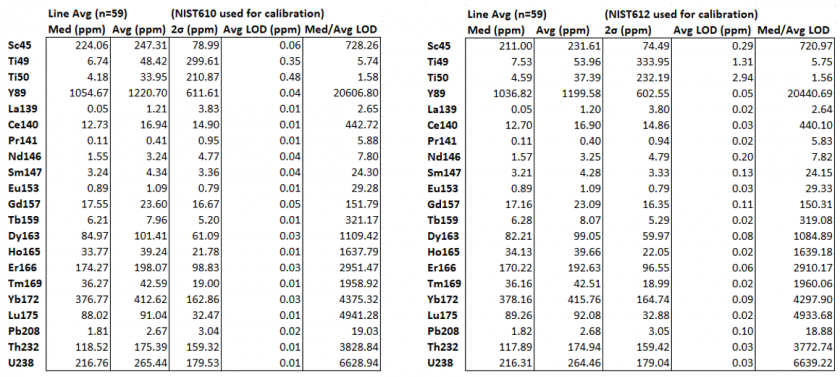
Figure 2. Line scan concentrations (ppm) reported as medians, averages, and limits of detection (LOD) using NIST610 (left) and NIST612 (right) as a the primary calibration standard.