
Technology in the Field
By Monica Kortsha
One of the most important skills a field geologist can develop is the ability to interpret rocks in their native environment.
Developing a keen eye is a good start. But at the end of the day, there’s only so much the human eyeball can do.
We can’t see below the surface. Or detect the tiny shifts in topography caused by tectonic movement underfoot. And although it may be possible to map the details etched into sheer-sided cliffs from up close, it takes more time and carabiners than most would care to spend.
To do all that, modern geoscientists depend on diverse technology — cameras, sensors, sounders and more — that shows parts of the world that would otherwise remain hidden.
Scientists at the Jackson School of Geosciences are using geosciences technology to take their powers of observation to new places. Some of the devices are cutting-edge and just making their way into the market, with the Jackson School’s early adapter role helping refine applications and further development. Others, borne of elbow grease and Walmart runs, show the power of creativity in problem solving.
PORTABLE SEISMOMETERS: PINT-SIZED PLATE TRACKING
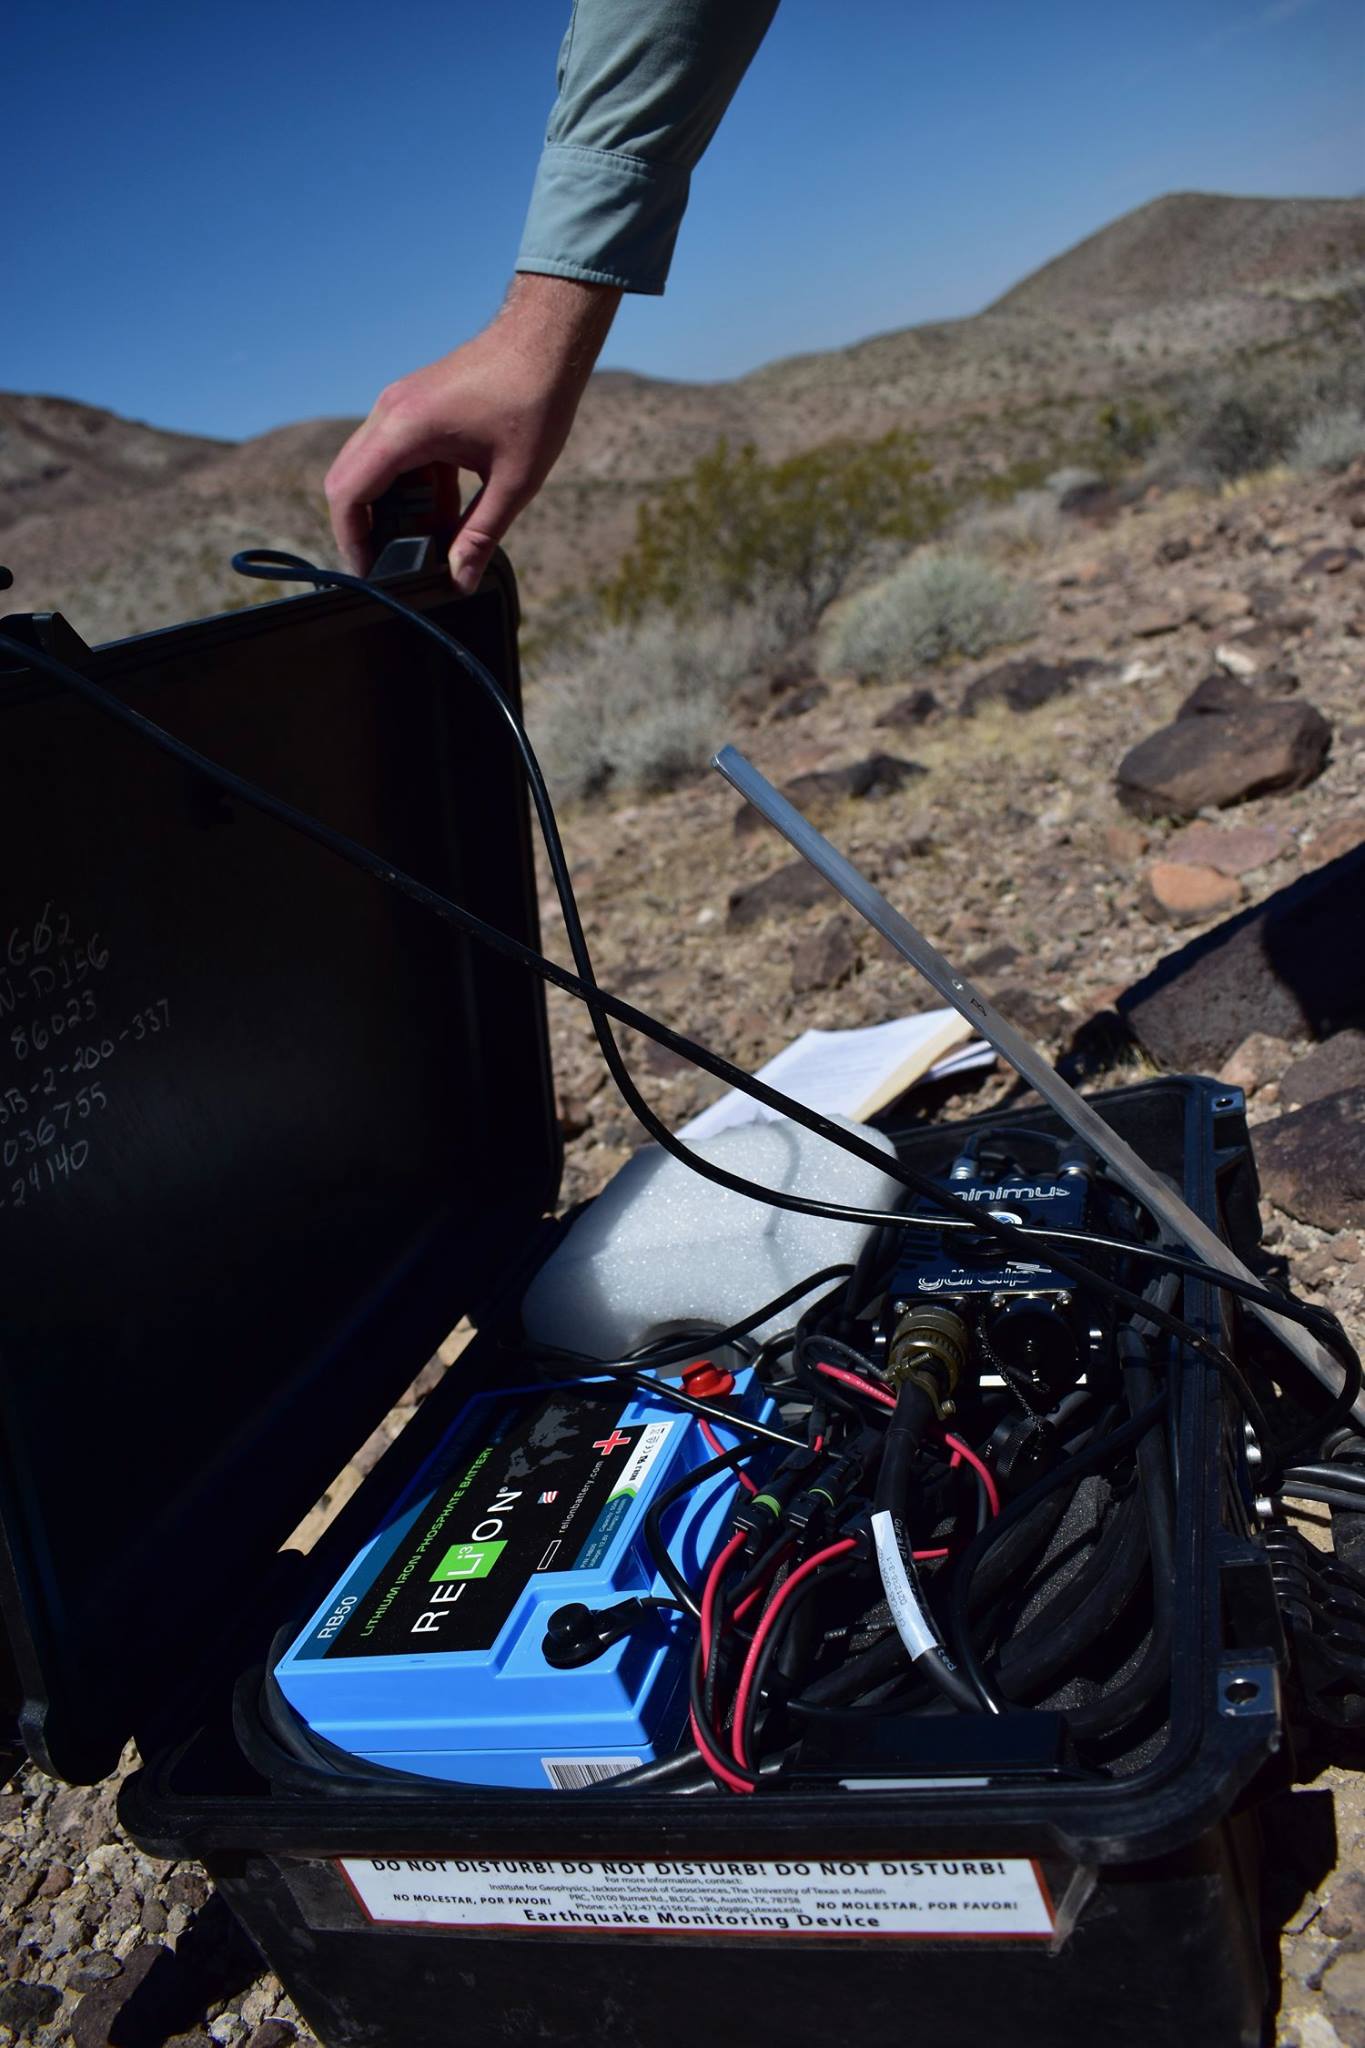
Geoscientists use seismometers to measure ground movement, with researchers often putting them to work along tectonic plate interfaces to track the daily movements of the plates.
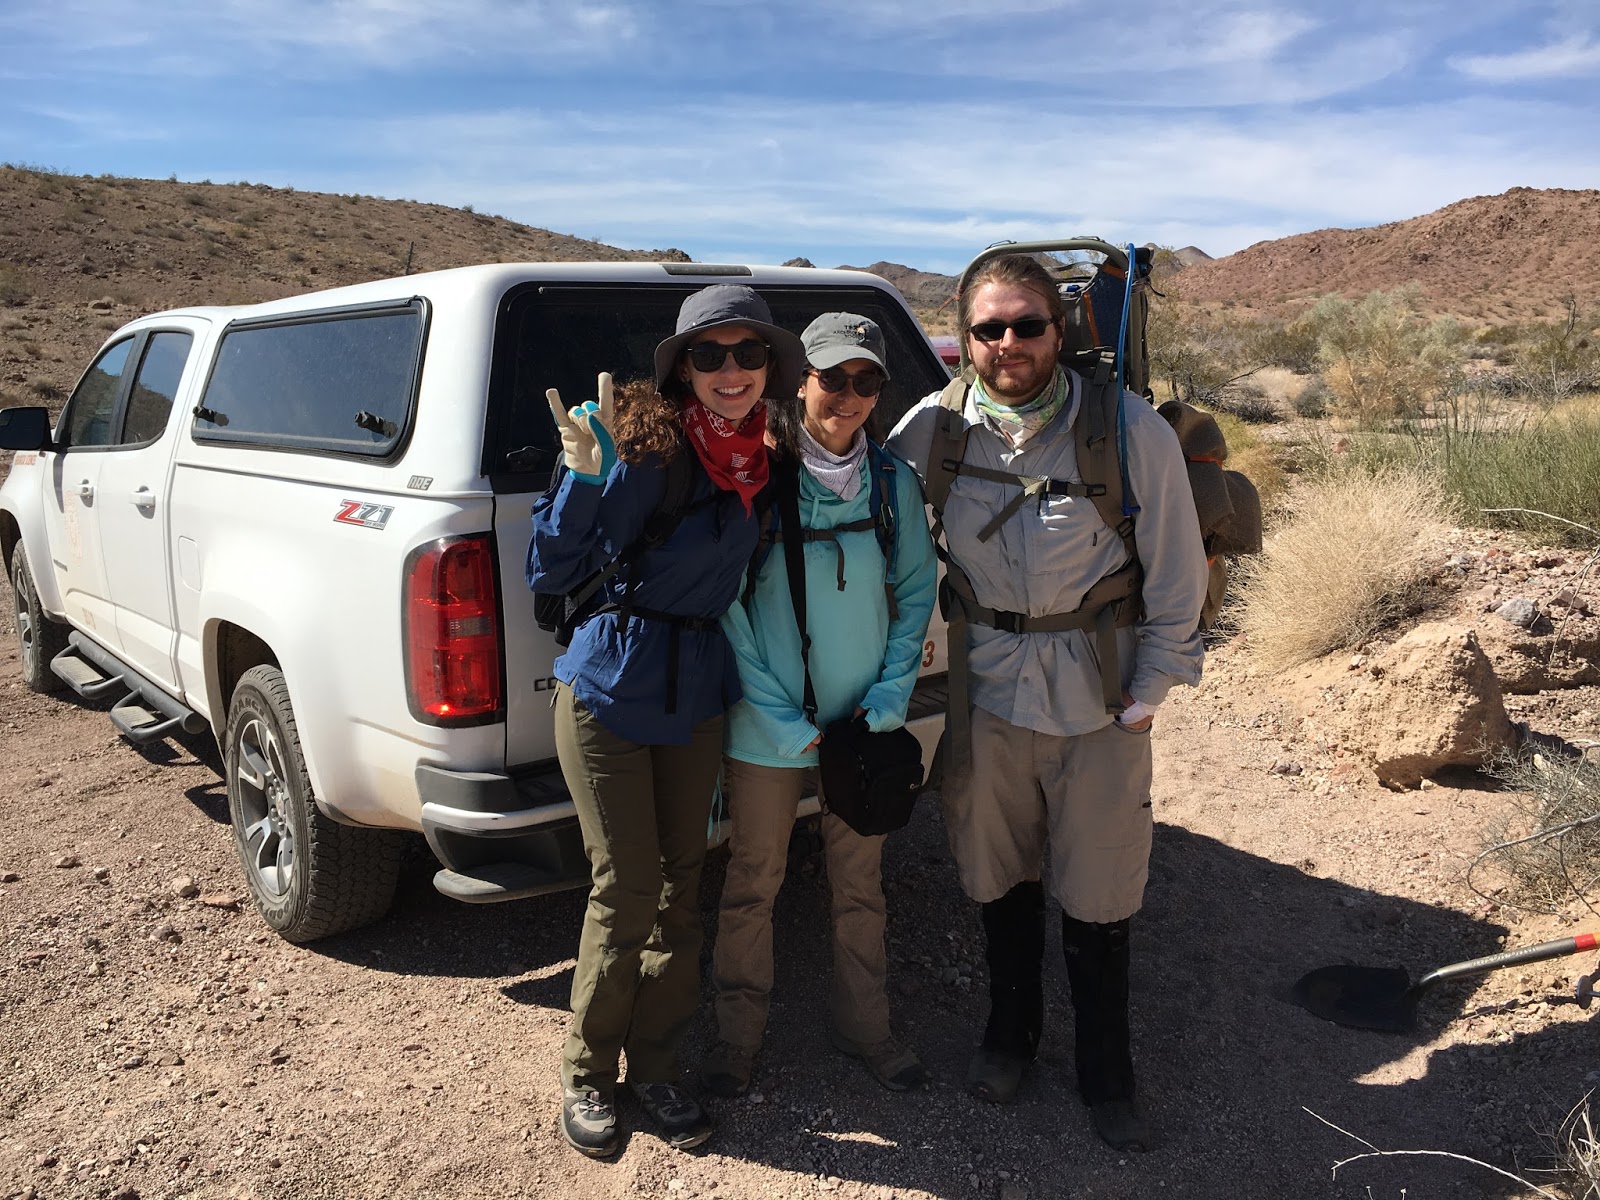
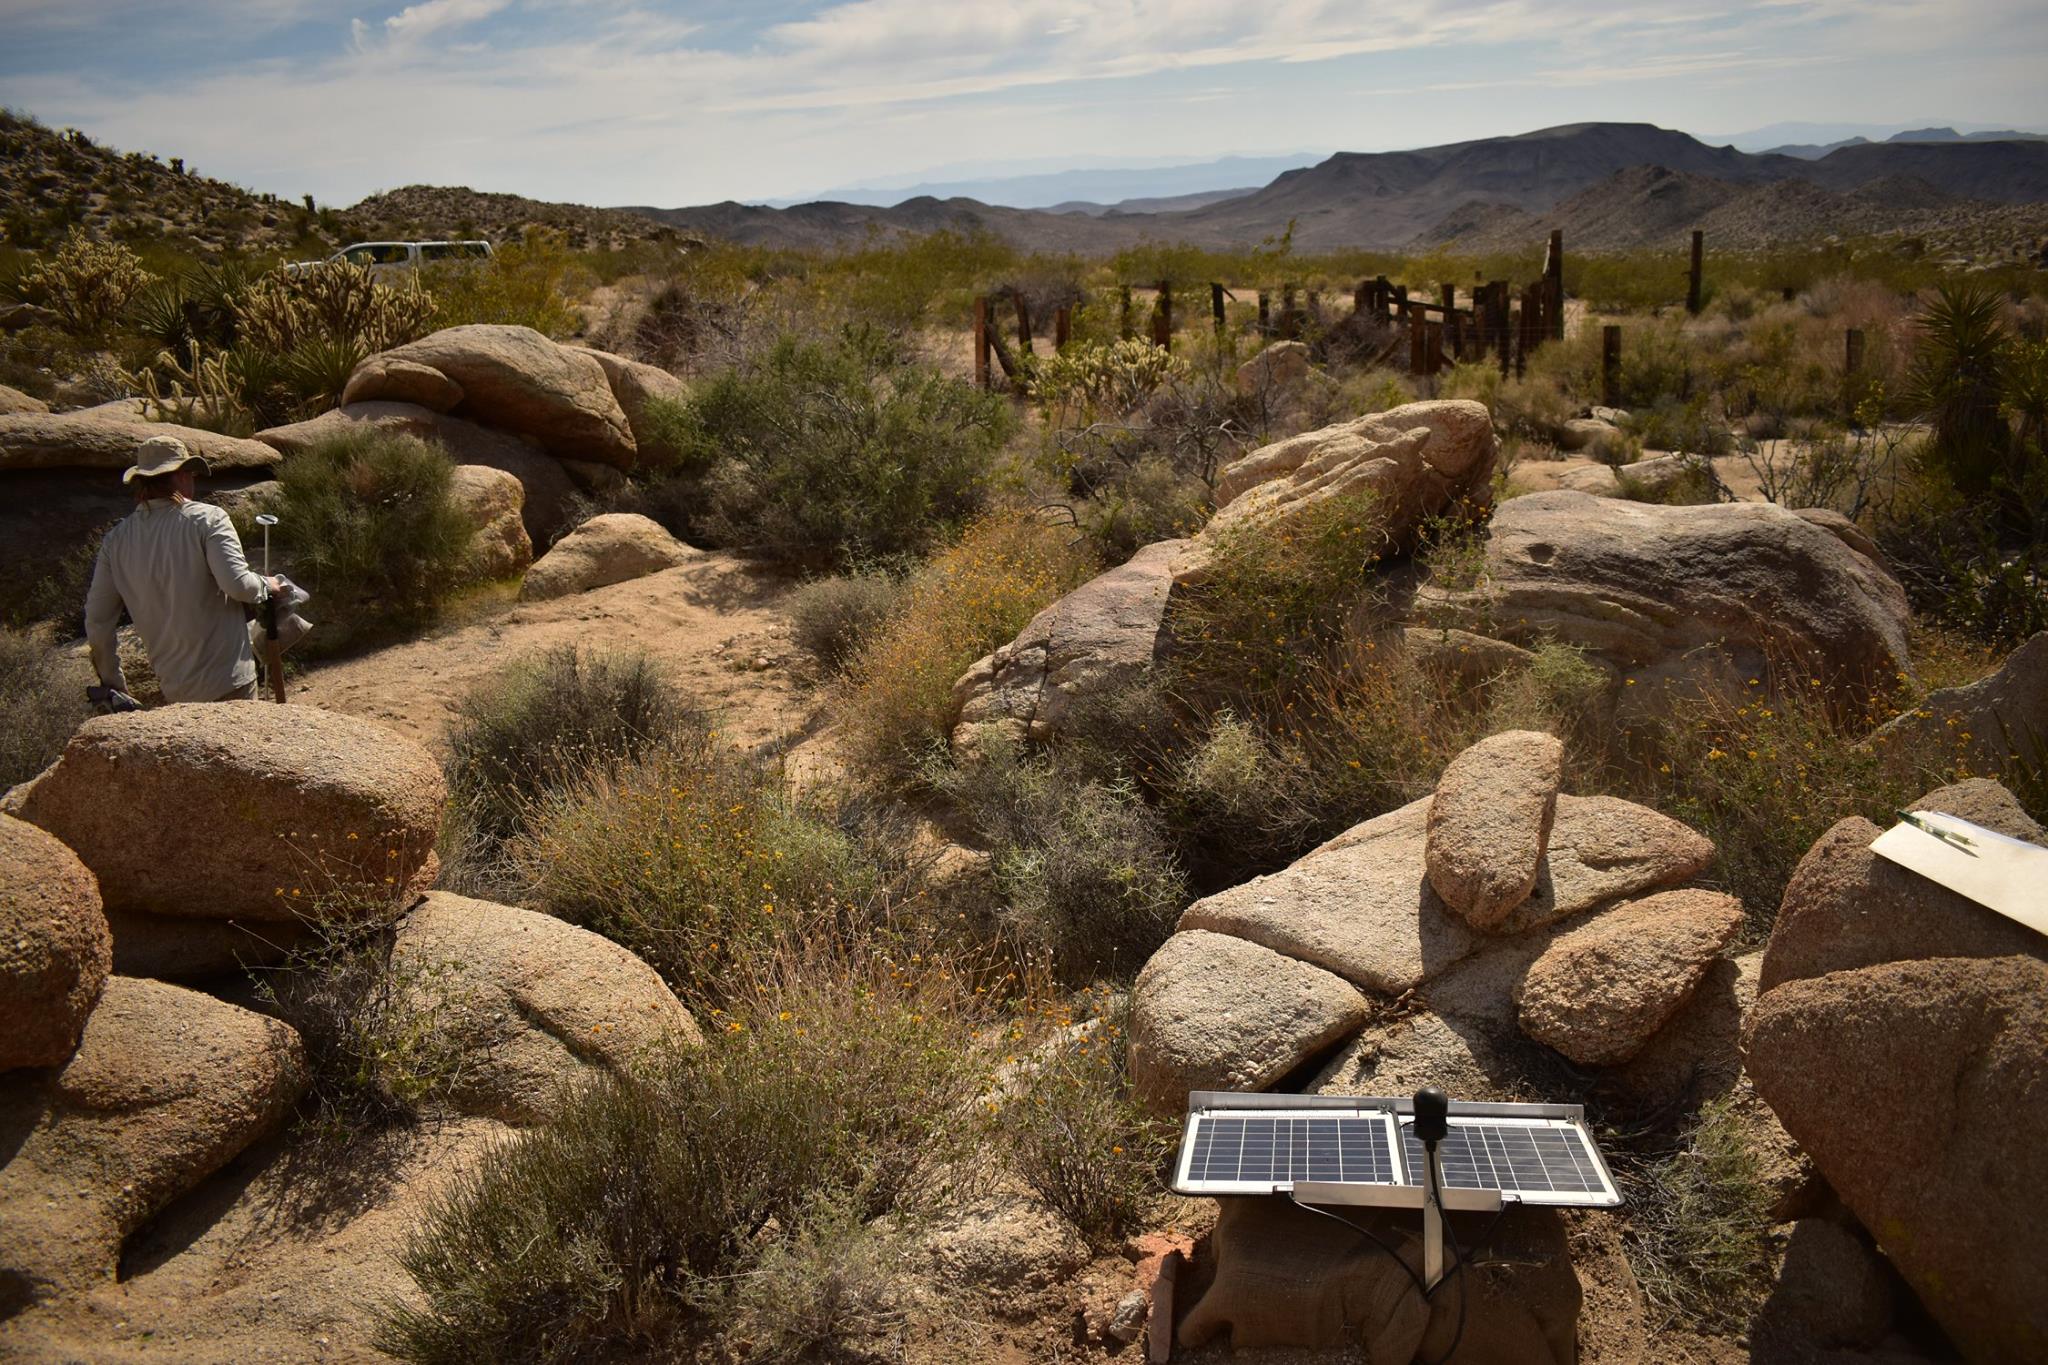
Rob Porritt, a postdoctoral researcher at the Institute for Geophysics, said he remembers spending long hours in the field installing seismometers — a process that involved mixing sand, cement and water, and moving heavy batteries and sensors. But he said that a new generation of pint-sized seismometers, only about the size of a soda can, is simplifying the installation process, and changing the type of work that’s possible and who can participate.
“This box weighs 50 pounds, and that’s everything you need for the station,” Porritt said about the seismometer and its associated machinery held inside a plastic container.“These, they are light enough that we can just put them on our packs and hike the 1 to 3 kilometers to our sites.”
Another improvement is the installation time. The boxes only take about an hour to get in the ground.
In April 2018, Porritt led a team of undergraduates to eastern California’s Mojave Desert to deploy 19 seismometers above a fault system about 150 miles east of the San Andreas fault, an active tectonic boundary and earthquake incubator. The project, overseen in part by the Jackson School’s Thorsten Becker and Whitney Behr (now at the university of ETH Zurich) and funded by the Southern California Earthquake Center, seeks to learn more about how nearby tectonic activity is deforming the fault, and how it might relate to tension between the plates that could be released as earthquakes.
The seismometer’s portable size allowed the team to hike to the area — cars are forbidden because of the area’s designation as a habitat for endangered desert tortoises — with UTIG research scientist associates Marcy Davis and Dan Duncan developing a seismic station design and installation protocol with the undergraduate researcher in mind.
“One of the design elements of this project was to make everything simple enough that an undergrad, without any help, could put it all together,” Porritt said.
The mission was a success: Undergraduates Ashlyn Zare, Jackie Rambo and Daniel Ortega-Arroyo successfully installed monitors, which, if all is in working order, are currently recording the seismic lurches and wobbles happening miles beneath the desert.
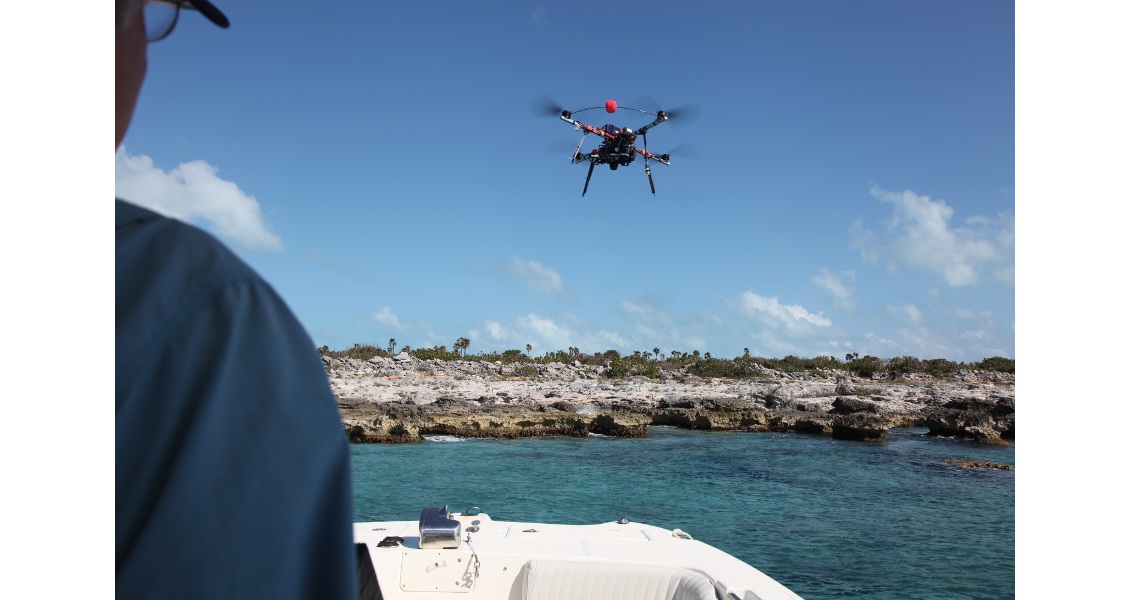
DRONES: FLY-BY GEOLOGY
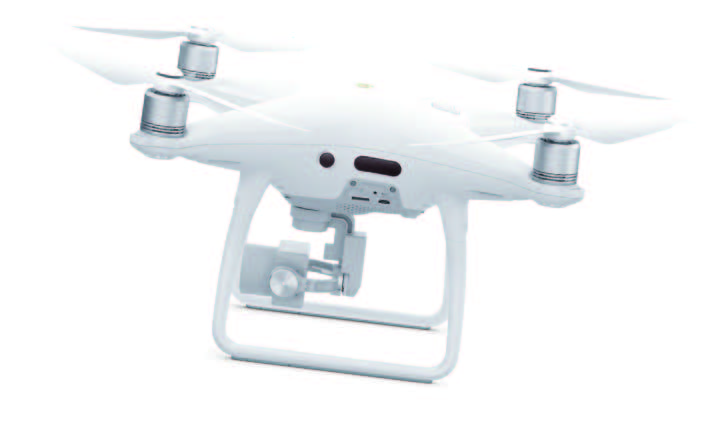
Sometimes, revolutionary technology solutions are available right off the shelf. Chris Zahm, a bureau research engineering scientist associate, said that drones — those small, whirring, and camera-equipped quadcopters — have revolutionized fieldwork by making hard-to-reach places easier to access.
“I remember being an early geologist and thinking — several times — man, if I could just fly and see what this looks like from the air,” Zahm said. “And now, suddenly, that’s possible.”
Earlier attempts by geologists to get a bird’s-eye view included releasing camera-mounted weather balloons into the wild and dangling poles equipped with cameras on a timer delay over cliffs. (Zahm said he attempted
that technique in graduate school with little success). Drones, easily toted in a backpack and operated via remote control, offer a much more maneuverable option.
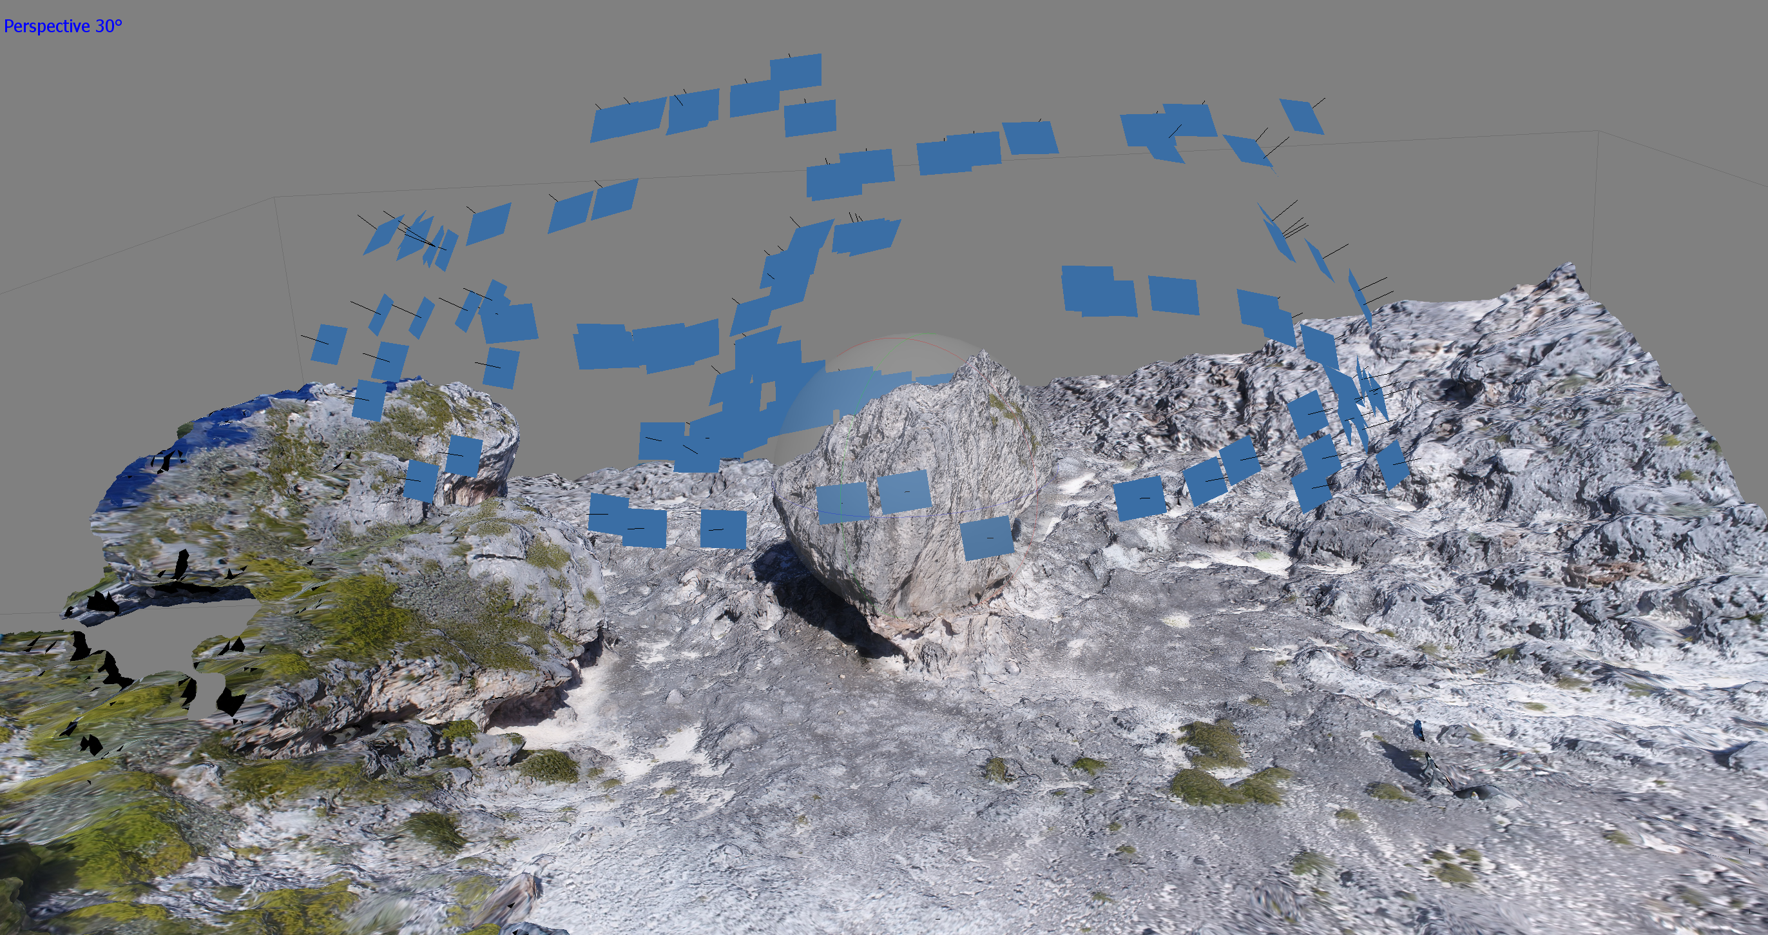
Zahm and Department of Geological Sciences Chair Charlie Kerans have been using drones to investigate the carbonate geology of Texas and New Mexico and various islands in the Caribbean for years, usually accompanied by a cadre of graduate students during summer field trips. This year, the group visited the island of Eleuthera and used a drone to photograph two gigantic boulders— dubbed “the cow” and the “the bull,” each reaching more than 20 feet tall. It’s a mystery how the duo got to their current spot, with many in the scientific community thinking an ancient storm might have hoisted them into position.
A drone flight around the boulders helped reveal their topography in new detail, bringing centimeterscale features into view. They also provided the raw material to conduct photogrammetry, a technique that pieces together photos from various vantage points to construct a 3D model. Zahm often uses photogrammetry to create topological maps of survey areas. In this case, the team applied the technique to calculate the weight and volume of “the cow,” with the boulder weighing between 518 and 620 tons, with a volume of 219 cubic meters.
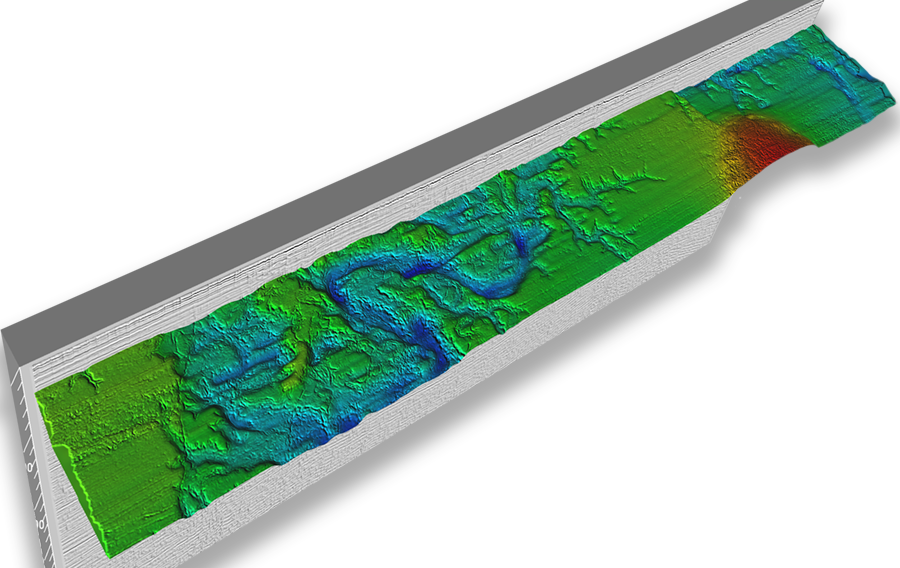
THE POD RACER: RADAR ON ICE
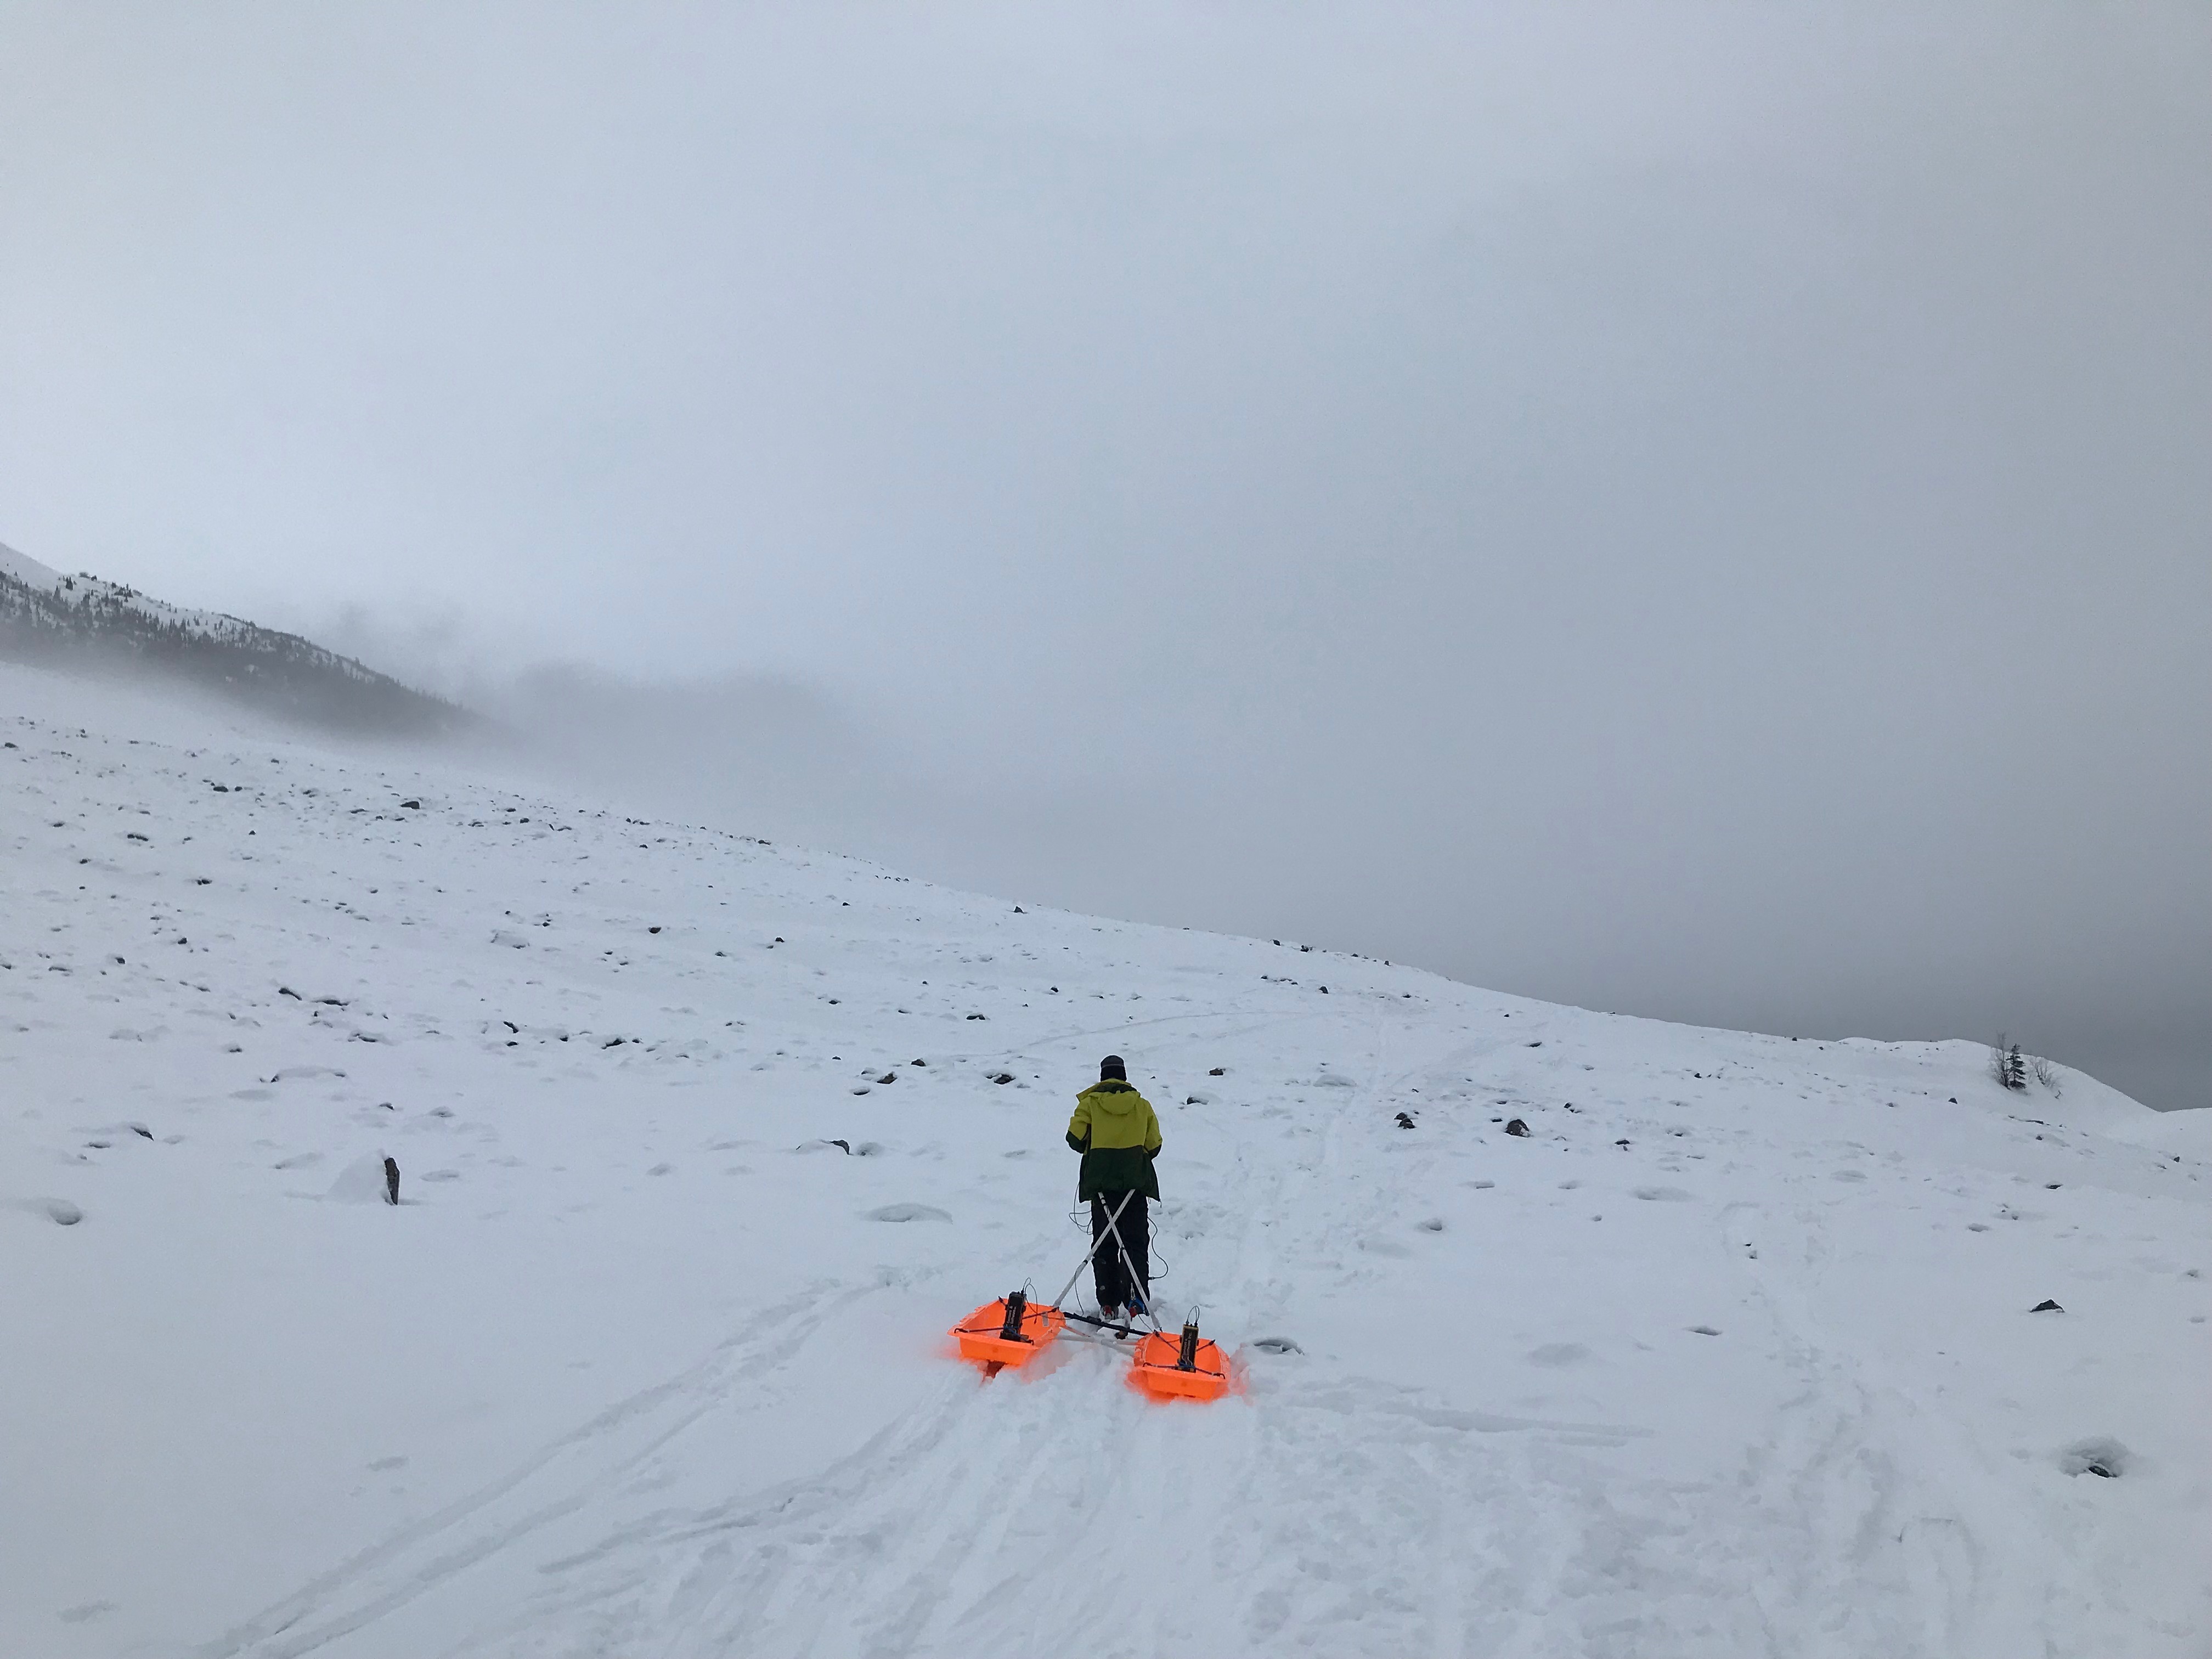
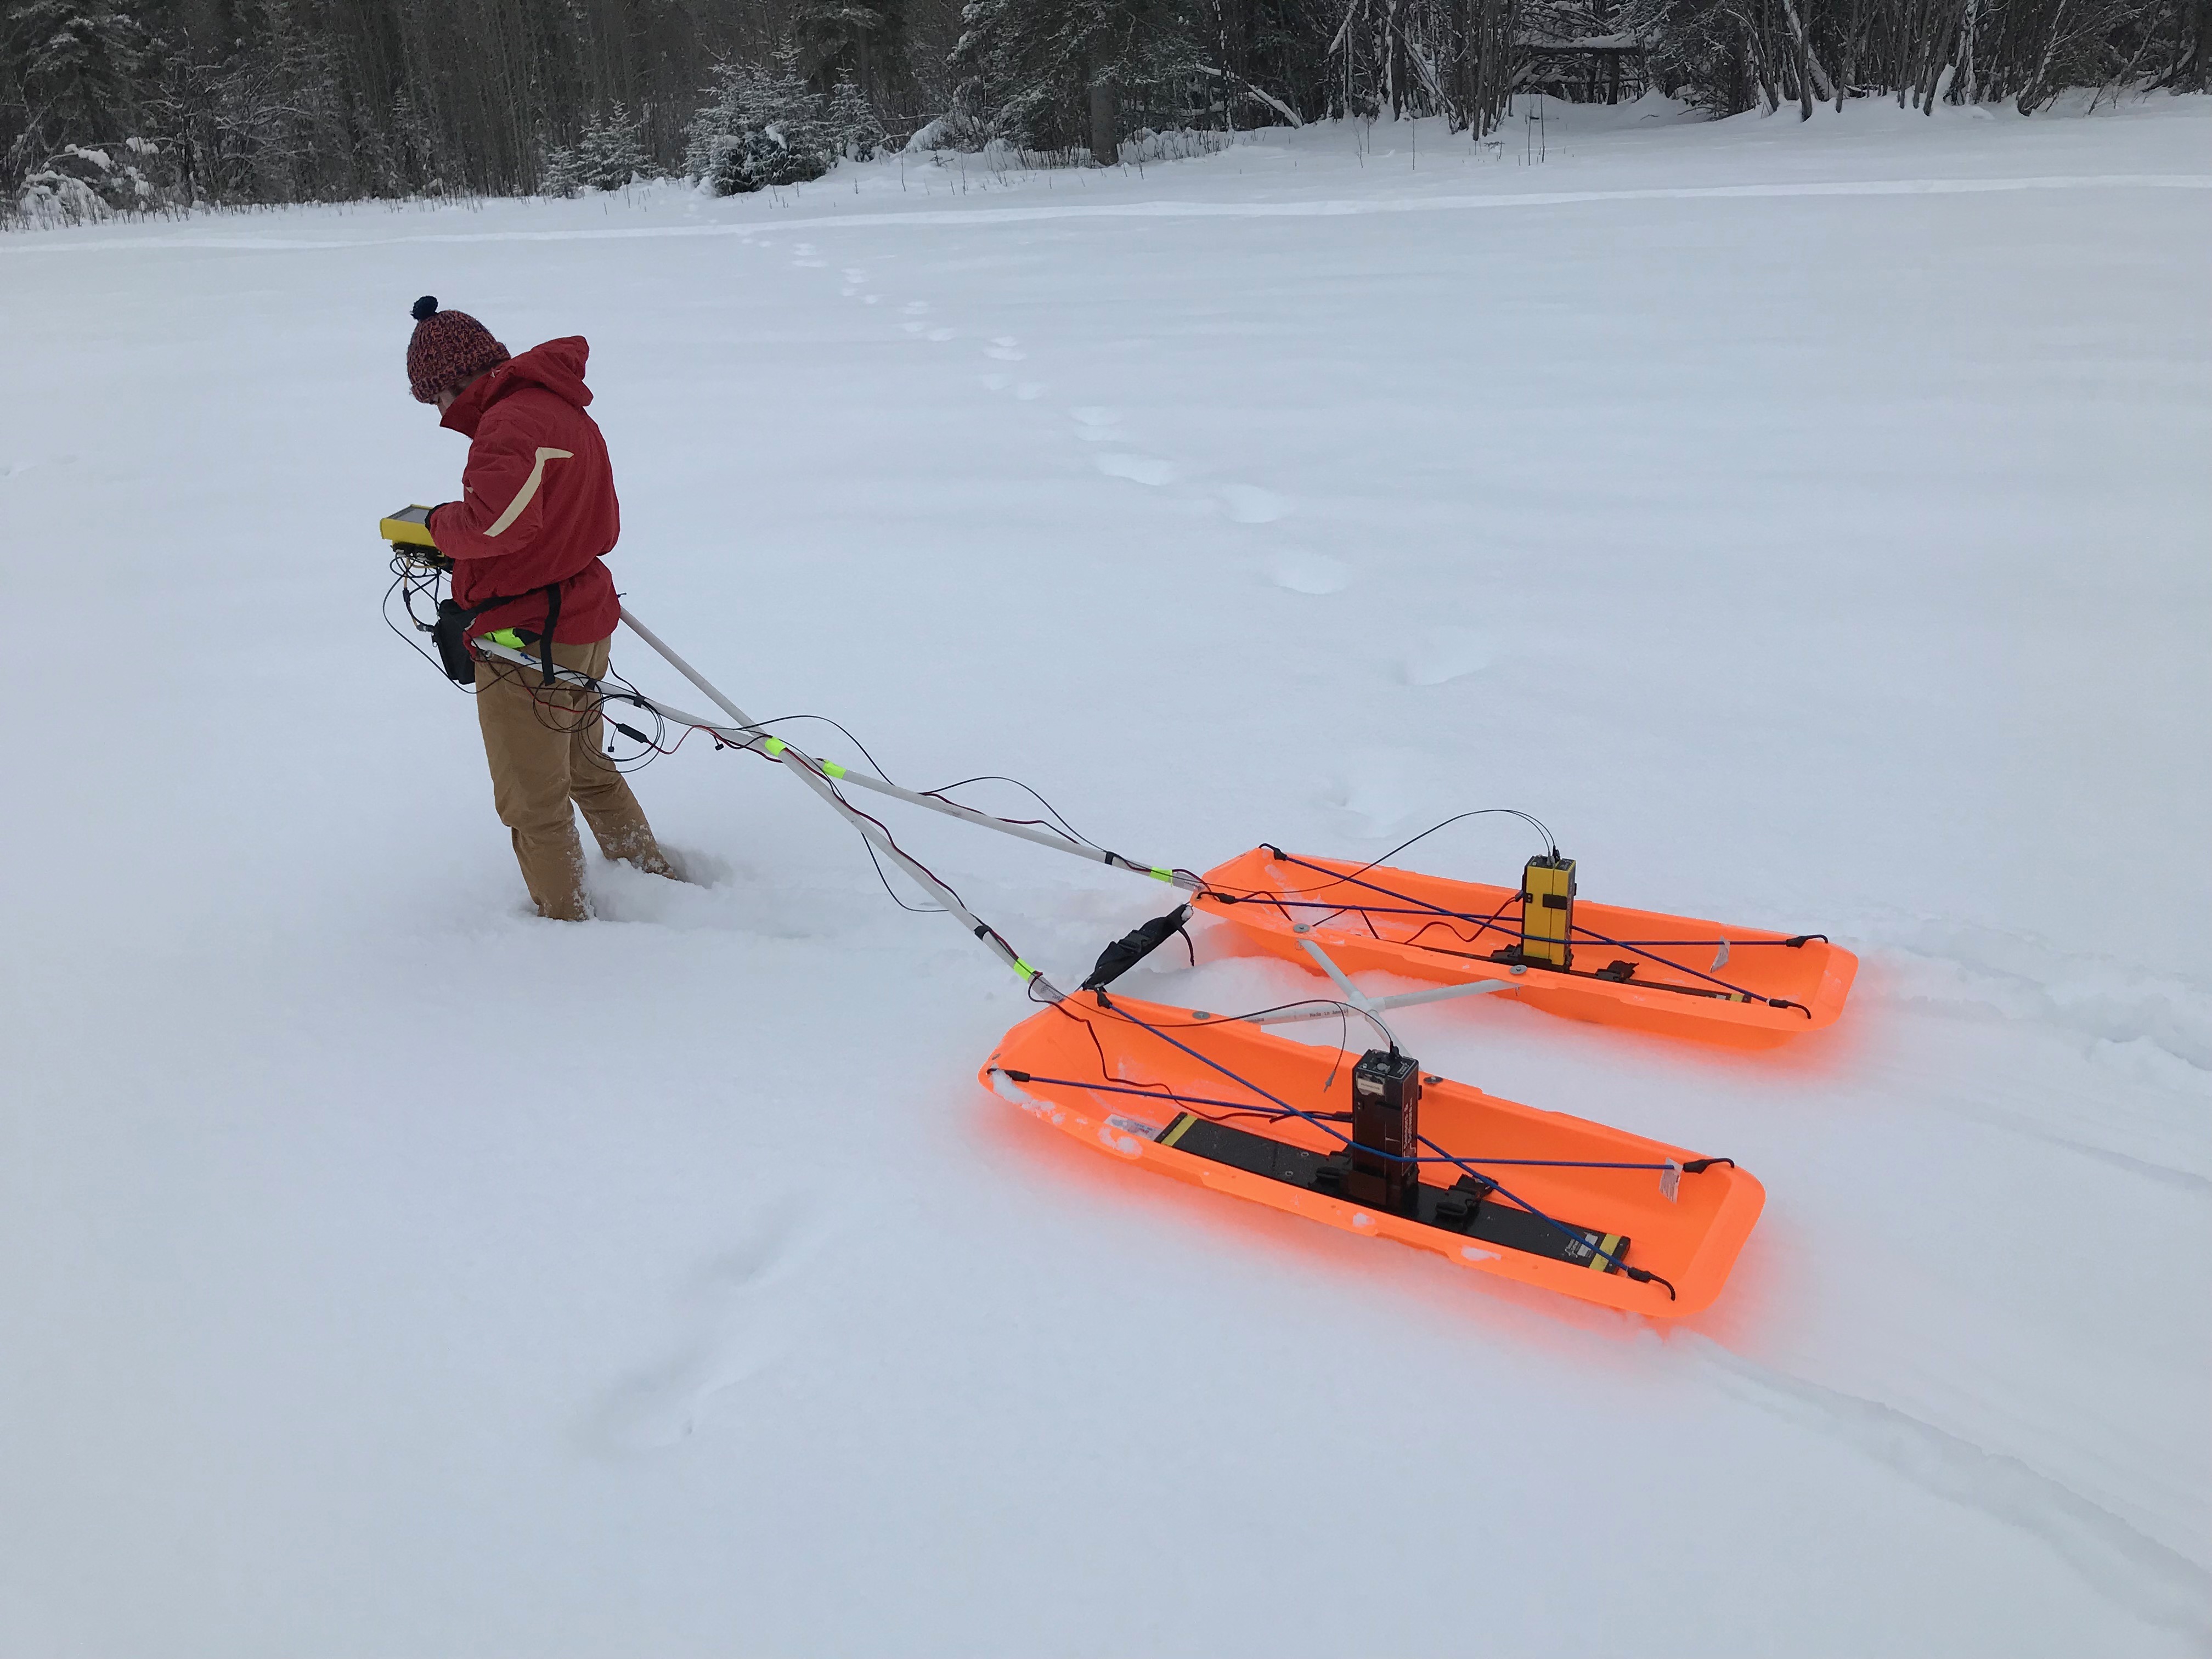
A RADAR SURVEY OF ALAKSA’S SOURDOUGH ROCK GLACIER USING A HOME-BUILT “POD RACER.”
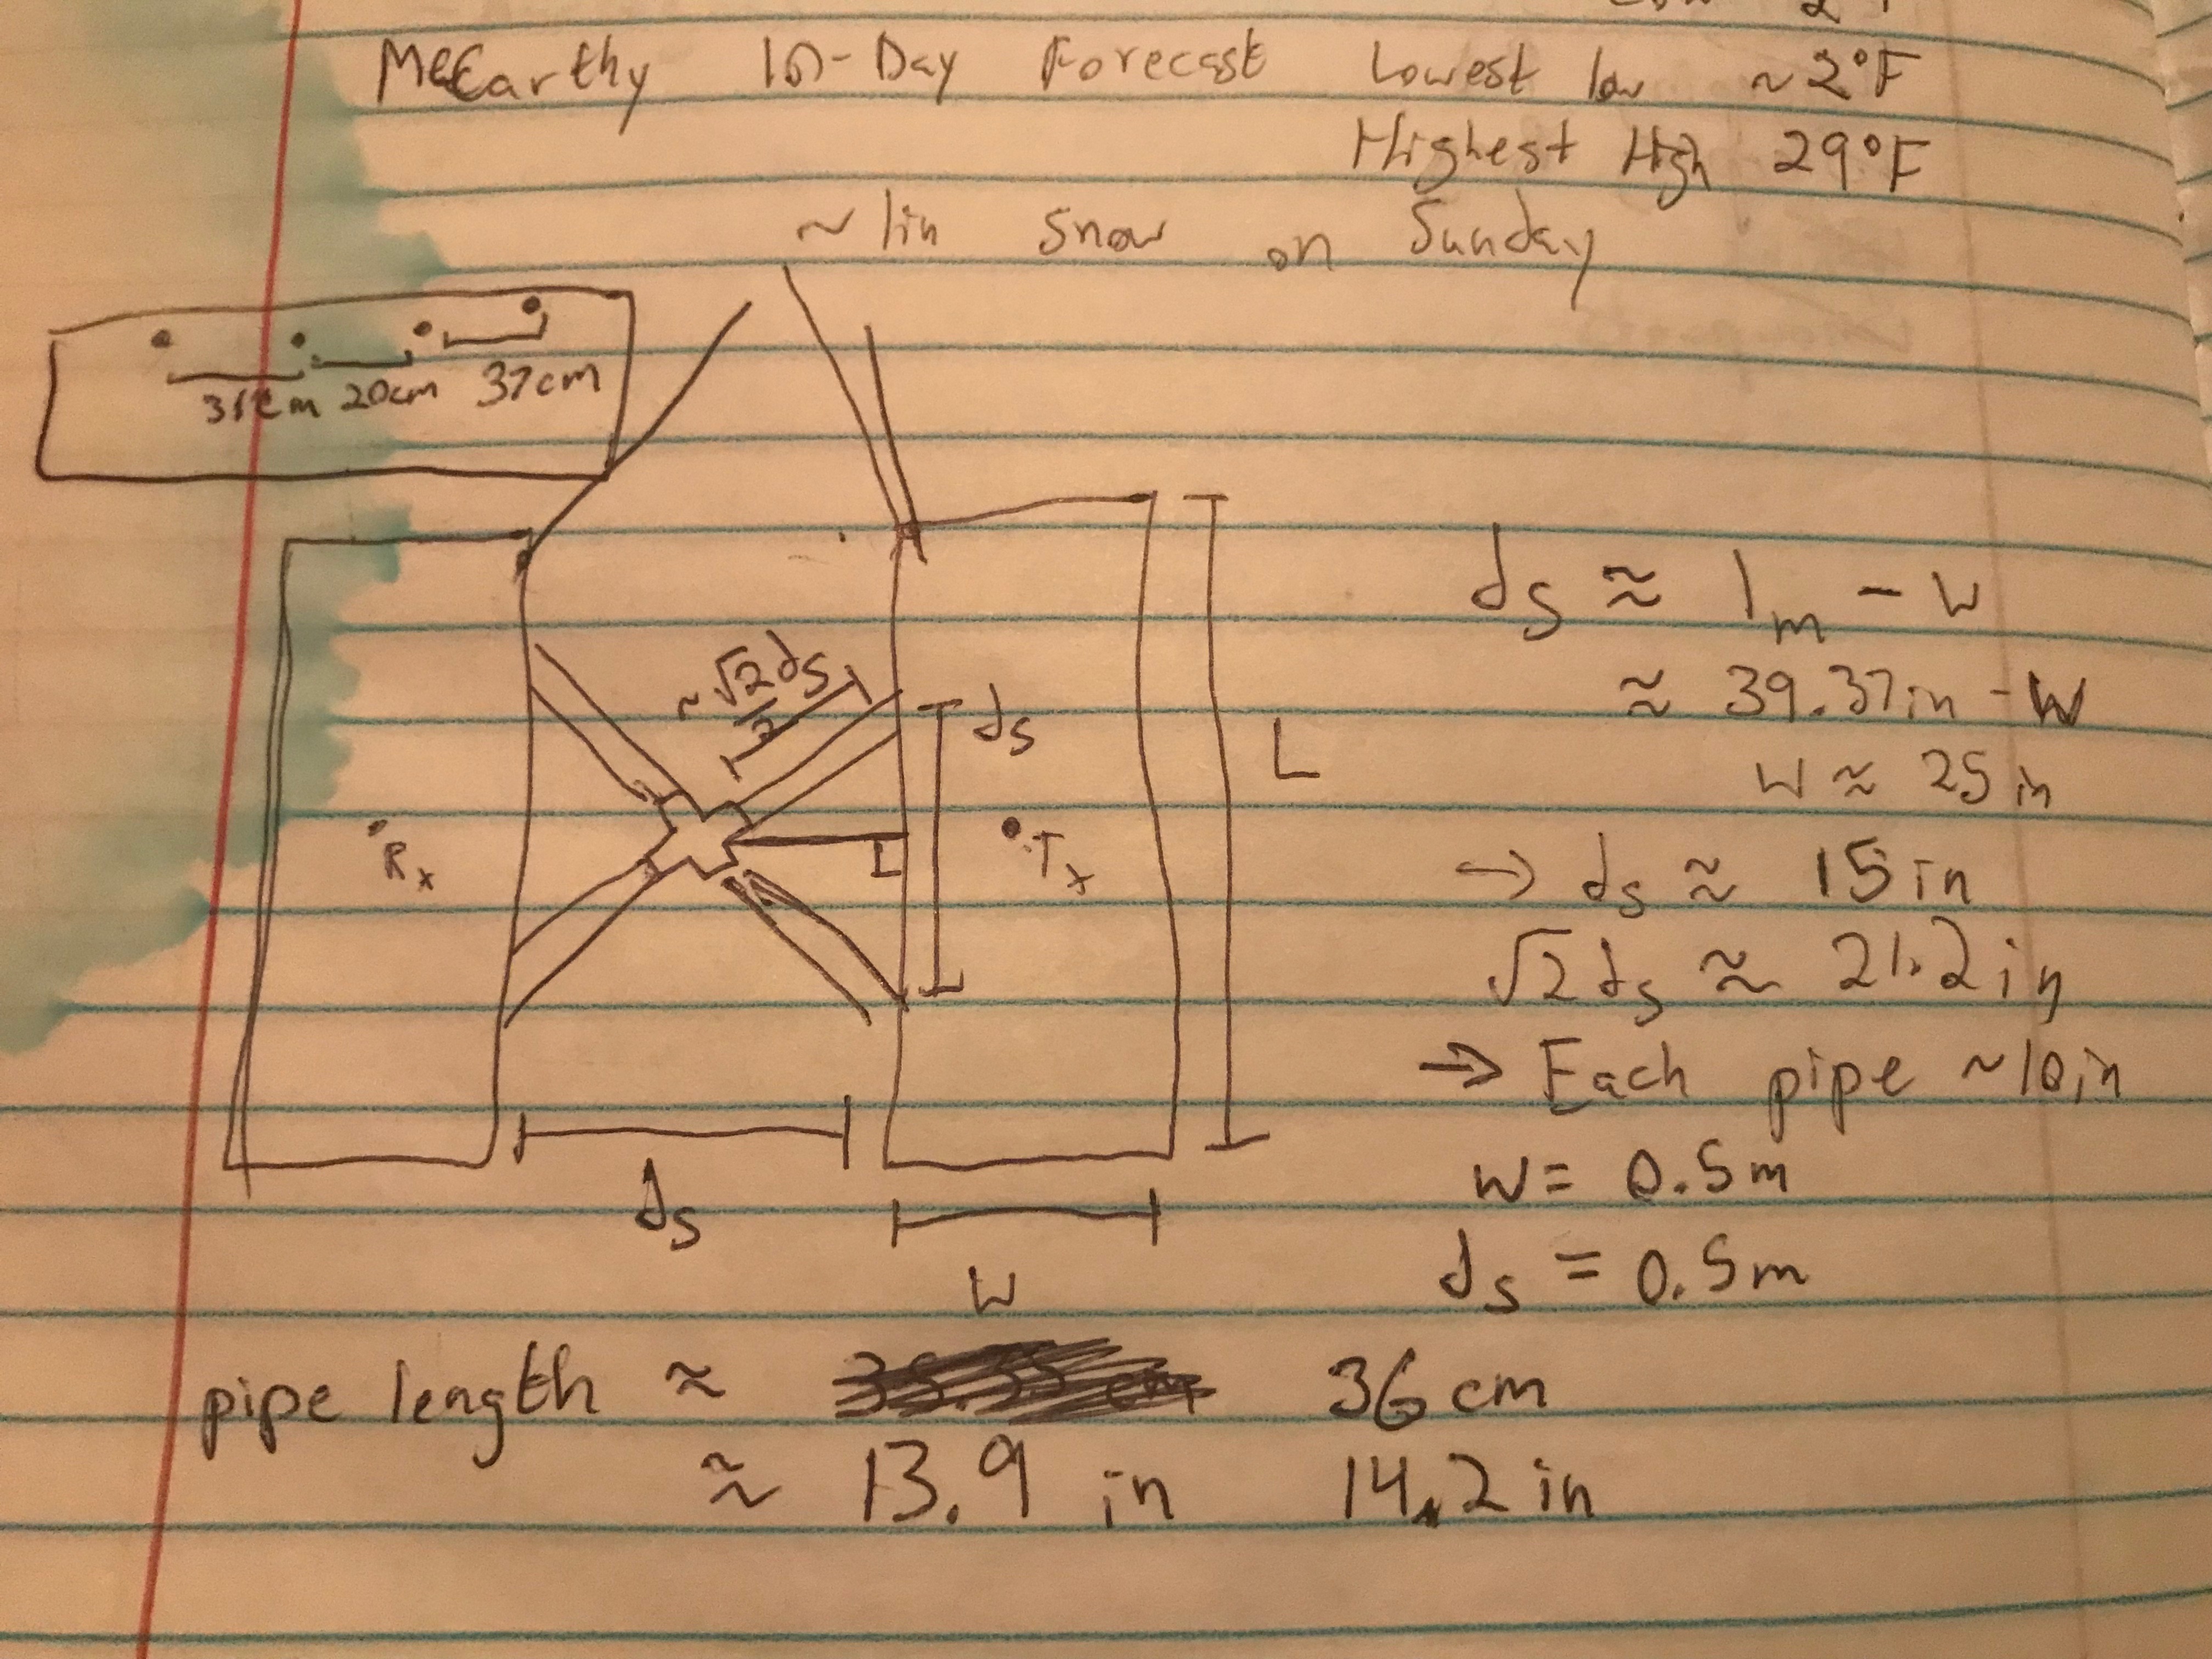
It doesn’t always take the latest and greatest technology to get big improvements in data collection. Graduate students Eric Petersen and Tyler Meng, who both study rock-covered glaciers and how their ice records climate fluctuations, were able to do it by simply putting their ground penetrating radar system on a sled.
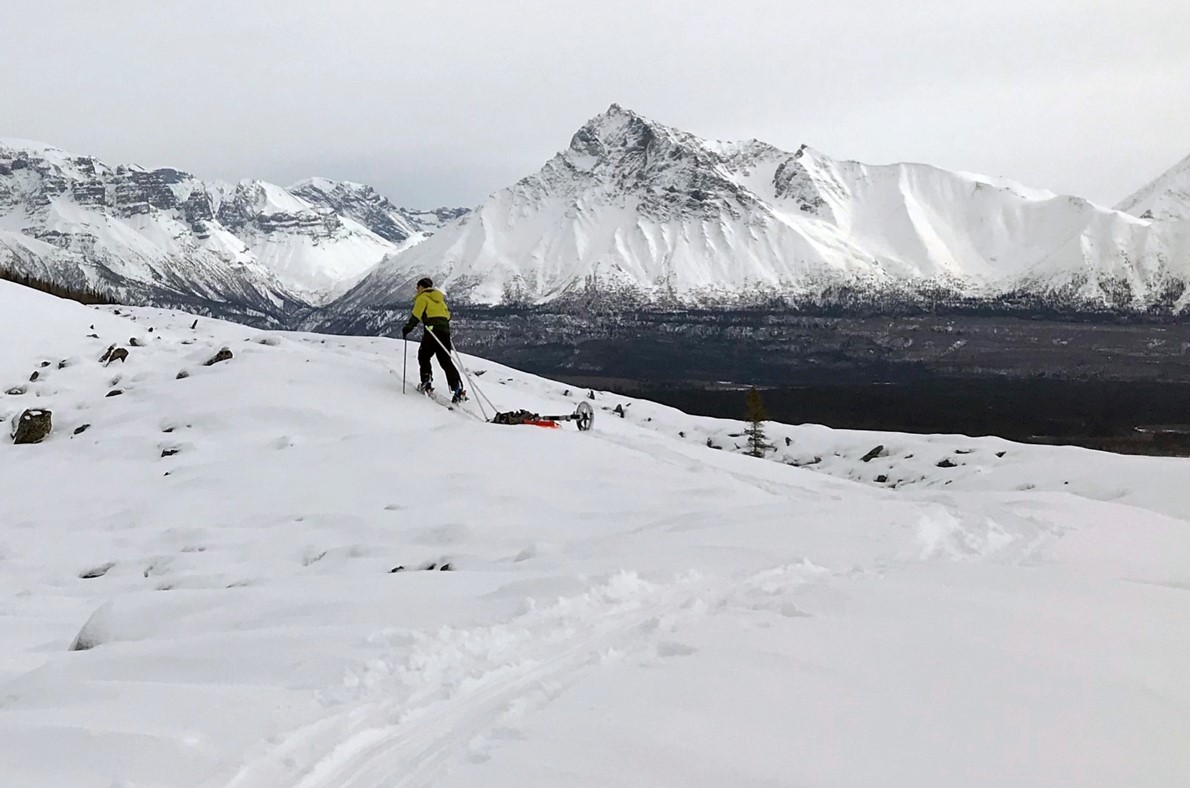
Petersen came up with the idea while walking radar equipment across parts of Alaska’s Sourdough Rock Glacier during a 2015 summer field work trip with his adviser Research Professor Jack Holt (now at The University of Arizona) and other students. Carrying the radar system across the cragged surface made for slow-moving surveying. Petersen thought that gliding the system over a winter snowpack could speed up the process.
“To [Texans], dragging a sled behind skis is a novel idea, but everyone does it up there,” Petersen said. “If you’re going somewhere, look at how people get around … it can be a good source of inspiration.”
In 2018, Petersen got his chance to try the design, with a Jackson School seed grant covering the travel and the supply costs of building the “Pod Racer” — the name Meng and Petersen gave to the two radar-toting sleds lashed together with PVC pipes and a handful of nuts and bolts.
“This was the most fun aspect of doing this project,” Meng said. “We came up with a rough idea of what we wanted to build and do, but we basically arrived in Alaska and bought all of the pieces and built it in a couple days.”
Meng estimates that the Pod Racer cost less than $200 to build. But that relatively inexpensive addition to the radar setup led to a significant boost in the data quality. The images of the glacier’s interior came back so clear that they didn’t need to go through the usual post-processing that the walking surveys required. And with Meng and Petersen taking turns pulling the Pod Racer on cross-country skis, they were able to cover more ground than ever before. A normal day of surveying on foot usually covered about 200 meters. On skis it was about 630.
The technique does come with a few caveats. Not all winters produce enough suitable snowfall on the glacier to use the sled. And the ones that do come with an avalanche risk that limits surveying to lower elevations. But the Pod Racer more than proved its worth, Petersen said, providing useful data and the confidence boost that comes with trying something new and succeeding.
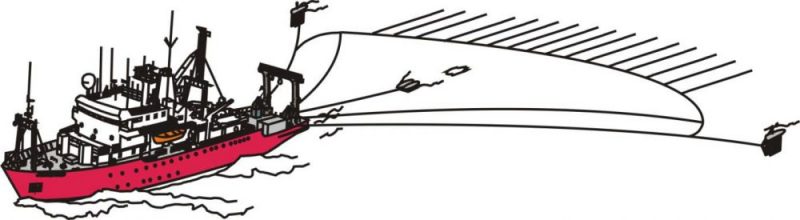
THE P-CABLE: CARBON STORAGE SCOUT
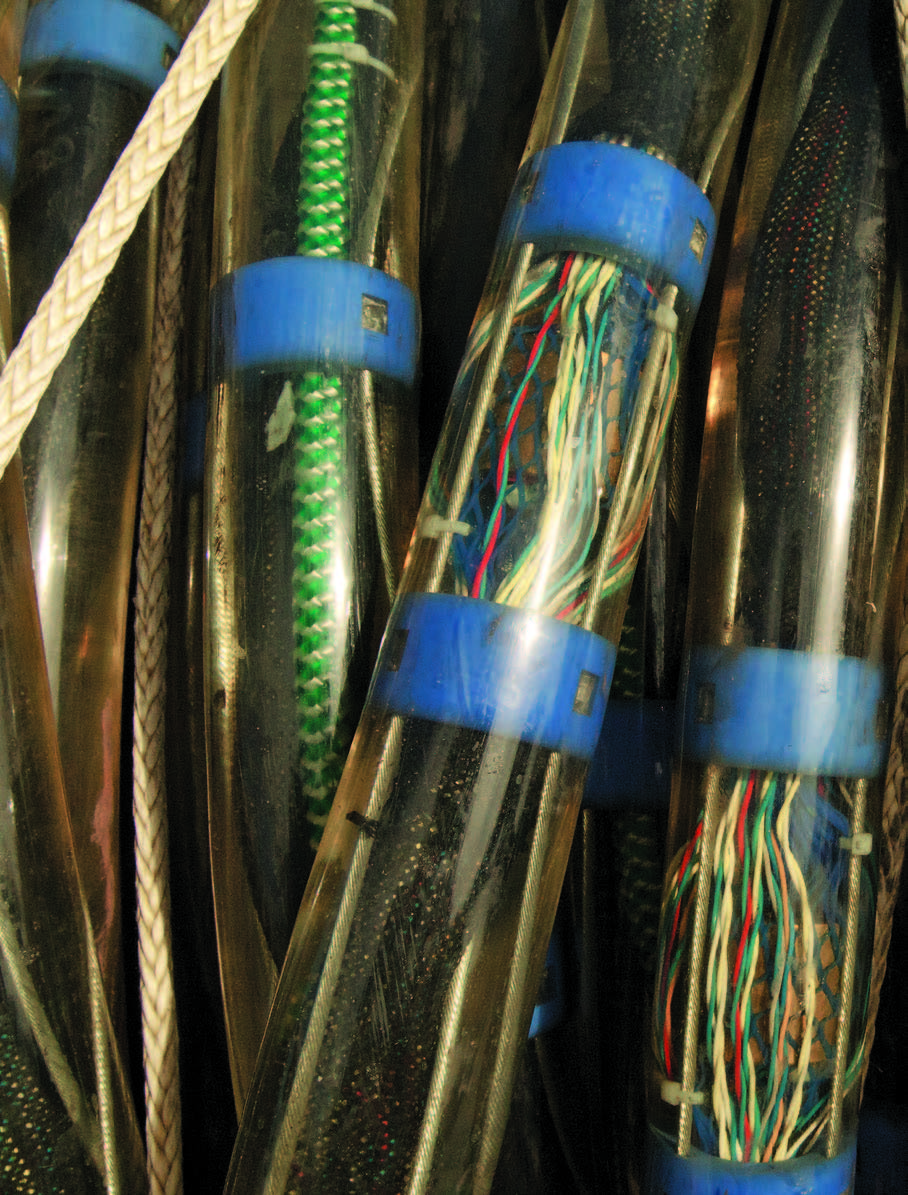
The P-Cable system acquired by the Bureau of Economic Geology in 2012 shows the strata of the sea floor in unprecedented detail — offering a resolution up to four times better than conventional seismic systems.
The system is best at revealing structures about a mile under the seabed — a zone that’s critical when scouting for potential carbon sequestration spots, said Tip Meckel, a researcher with the bureau’s Gulf Coast Carbon Center. Faults and fractures in this stratigraphy could serve as passageways and escape valves for carbon dioxide injected deep below.
“You can see migrating methane in the subsurface, and that helps you understand whether you have preferential flow paths for CO2 to the surface,” Meckel explained. “And we’ve definitely been identifying sites that we think are suitable for long-term safe CO2 storage.”
The reason for the improved resolution lies in the P-Cable’s streamers — plastic tubes embedded with sound receivers that are pulled behind a survey vessel. They’re short — only 25 feet long, in comparison with the kilometers-long streamers used by conventional systems. The compact design keeps them from getting tangled, allowing for more streamers in a single area and resulting in a more refined image.
Meckel described surveying with the P-Cable streamers “like combing the sand with a finer rake.”
To Meckel’s knowledge, The University of Texas at Austin is the only university in North America conducting research using P-Cable technology, with the bureau acquiring the $2.5 million system with help from a Department of Energy grant. Meckel has put the technology to the test during several surveys offshore of Texas, as well as a six-day survey in 2017 at the Tomakomai carbon storage site, an active carbon dioxide injection site offshore of the Japanese island of Hokkaido.
Meckel said that these surveys are helping determine best practices for P-Cable deployment, and that an international conference series focused on offshore CO2 storage started by the Gulf Coast Carbon Center in 2016 is helping spread the word.
At the moment, the surveys are primarily for basic research purposes. However, with Texas and other states already passing regulations governing carbon storage, it’s just a matter of time until this data could turn into an important resource for companies looking for places to safely store the greenhouse gas. In addition, Meckel said that there’s a whole world of subsurface geology that the P-Cable could help illuminate.
“This type of tool could be used for studying Quaternary [period] relative sea level change. You could use it to study geologic hazards,” Meckel said. “Anywhere where better resolution is needed is an interesting target for this technology, and it could be used to study a diversity of geologic interests that are in a relatively unexplored part of the stratigraphy below the sea floor.”
HELPFUL TECH
Technology is not a panacea to problems in Earth science. That eyeball still needs to be honed and tested to know when something is worth examining or ignoring. But with the new vantage points offered by the technology — from the hightech and high-dollar devices, to humble DIY projects — geoscientists are able to see more of the planet than ever before. Petersen, onehalf of the team that developed the Pod Racer, said that opportunities abound for creative application and invention. He urges everyone to scout
out their surroundings and strive to see more.
“I encourage everyone to MacGyver,” Petersen said, referring to the improvisational problem solving style of the 1980’s TV show character Angus “Mac” MacGyver. “Put on your skis, but be safe!”
The University of Texas at Austin
Web Privacy | Web Accessibility Policy | Adobe Reader