
Map Shows Slowdown of Ice Sheet
November 3, 2016
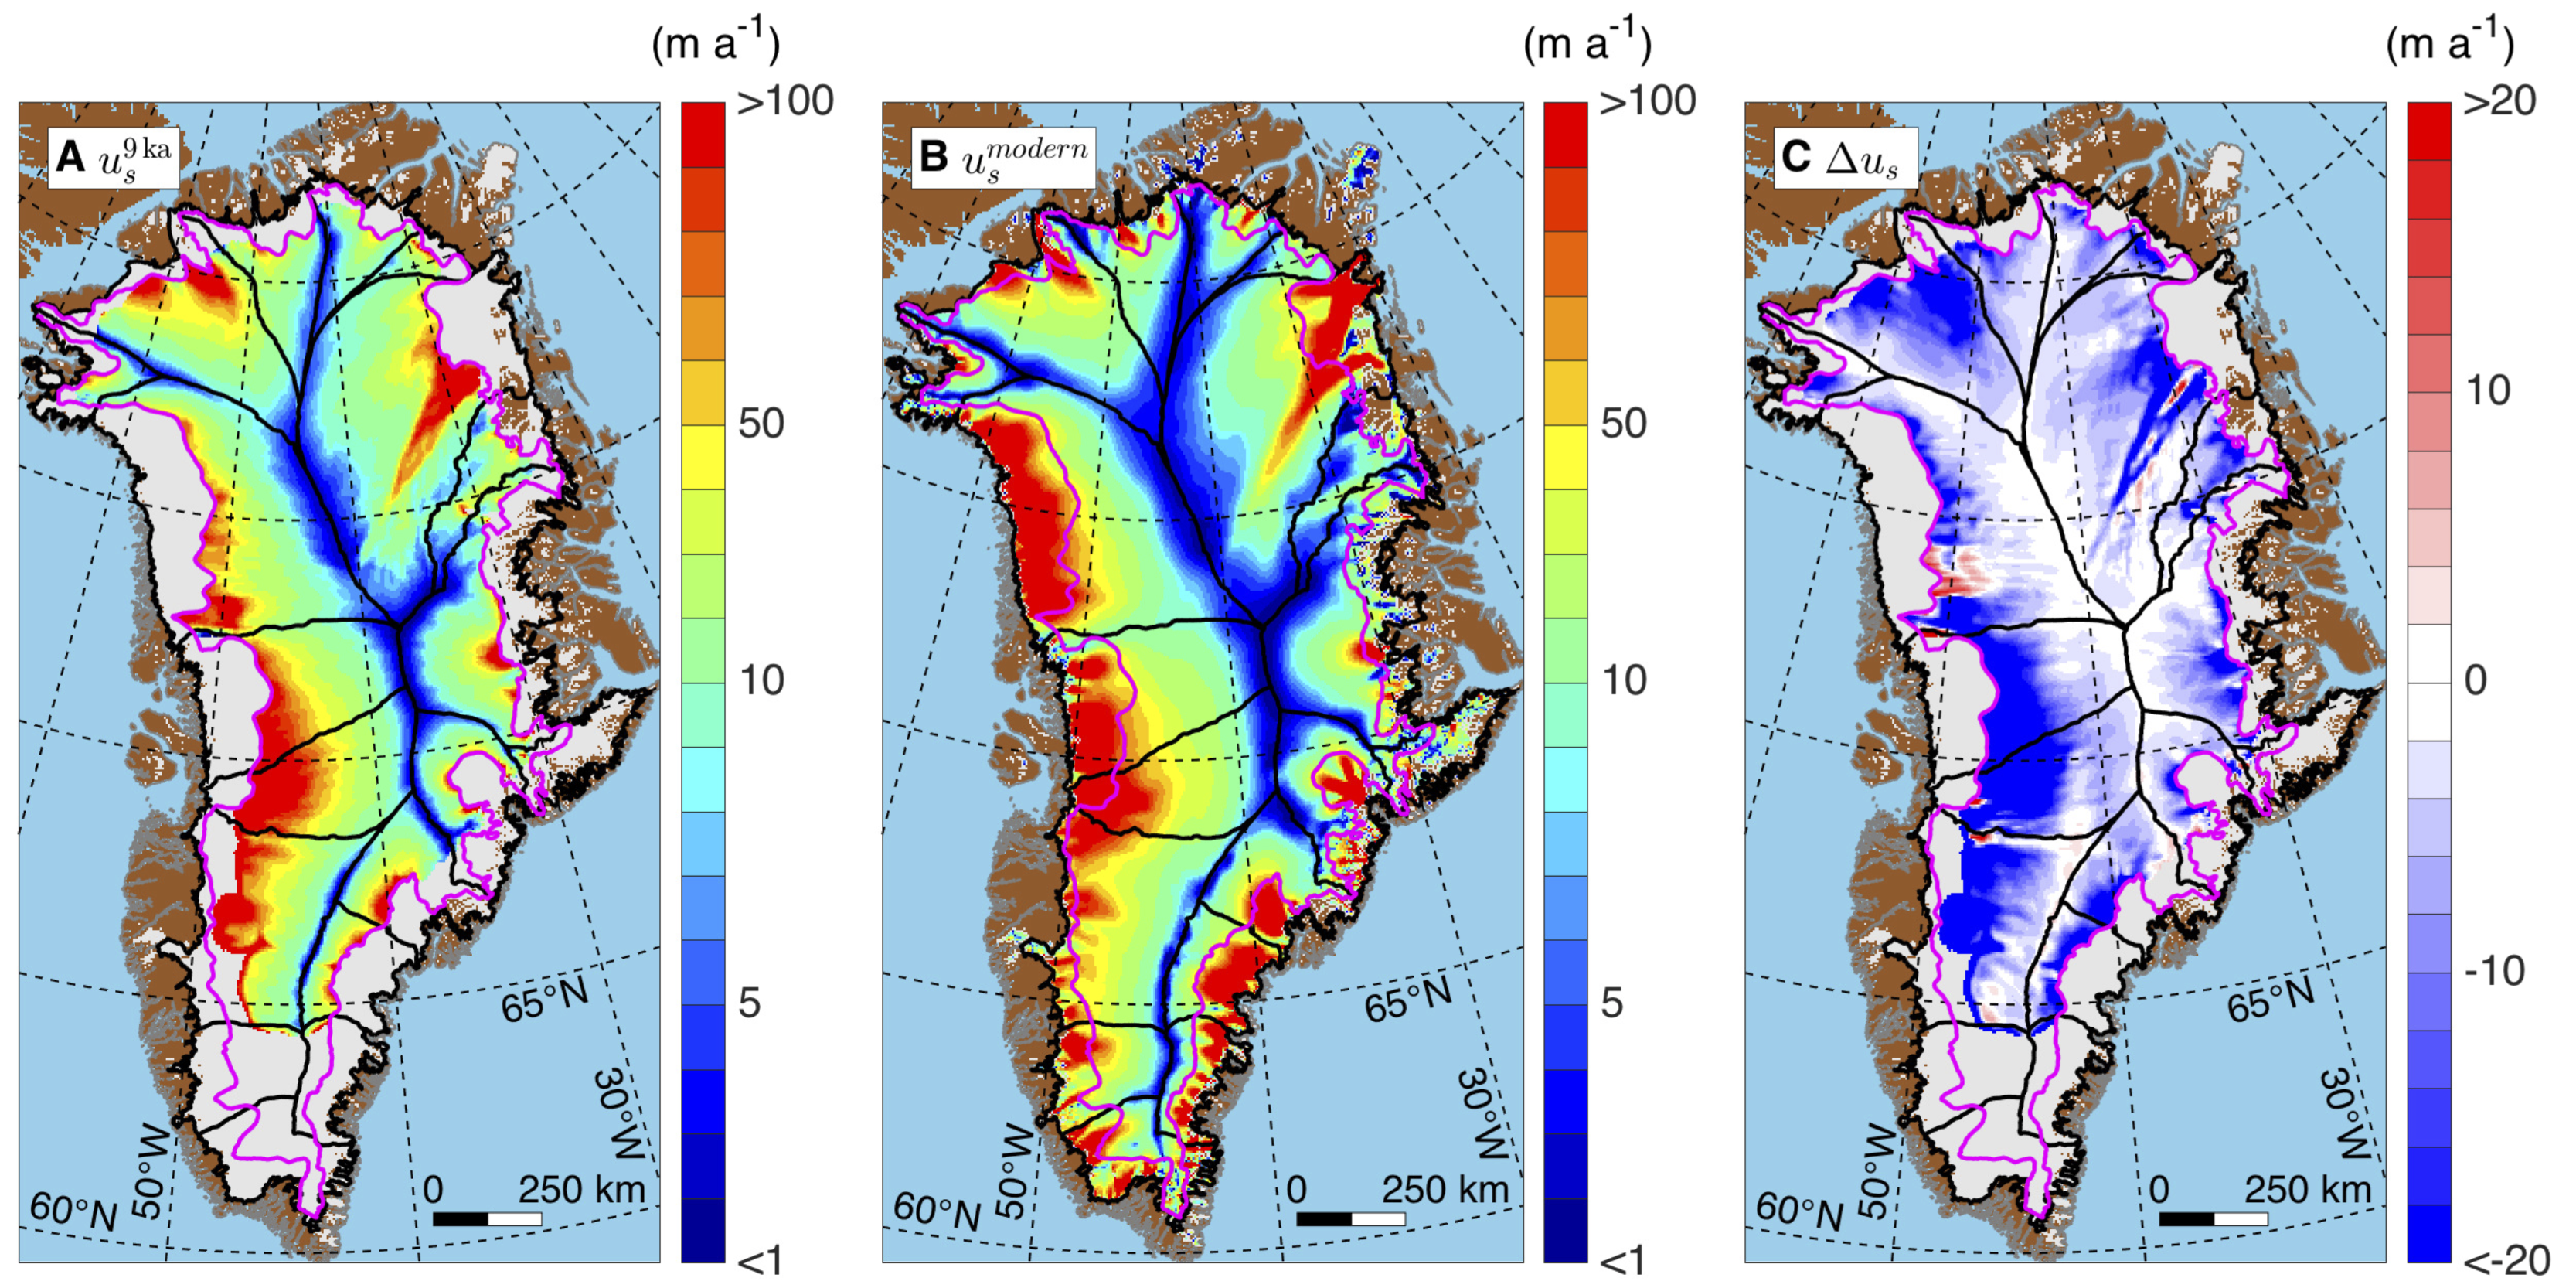
Scientists have created the first map that shows how the Greenland Ice Sheet has moved over time, revealing that ice in the interior is moving more slowly toward the edges than it has, on average, during the past 9,000 years.
The findings, which researchers said don’t change the fact that the ice sheet is losing mass overall and contributing to sea-level rise, were published in the Feb. 5, 2016, issue of Science.
Along Greenland’s periphery, many glaciers are rapidly thinning. However, the vast interior of Greenland is slowly thickening, a process the new study clarifies.
“Scientists are very interested in understanding how ice sheets flow and how that flow may have been different in the past. Our paleo-velocity map for Greenland allows us to assess the flow of the ice sheet right now in the context of the past several thousand years,” said lead author Joe MacGregor, a research associate at the University of Texas Institute for Geophysics (UTIG).
The study builds on earlier UTIG-led research that developed a database of the many layers within Greenland’s ice sheet. Using this database, the scientists determined the flow pattern for the past 9,000 years—in effect creating a “paleovelocity” map.
UTIG Research Associate Ginny Catania, who is also an associate
professor in the Department of Geological Sciences, and scientists from University of Alaska Fairbanks, University of California Irvine and The University of Kansas worked on the study. This study was supported by the National Science Foundation and NASA’s Operation IceBridge.